
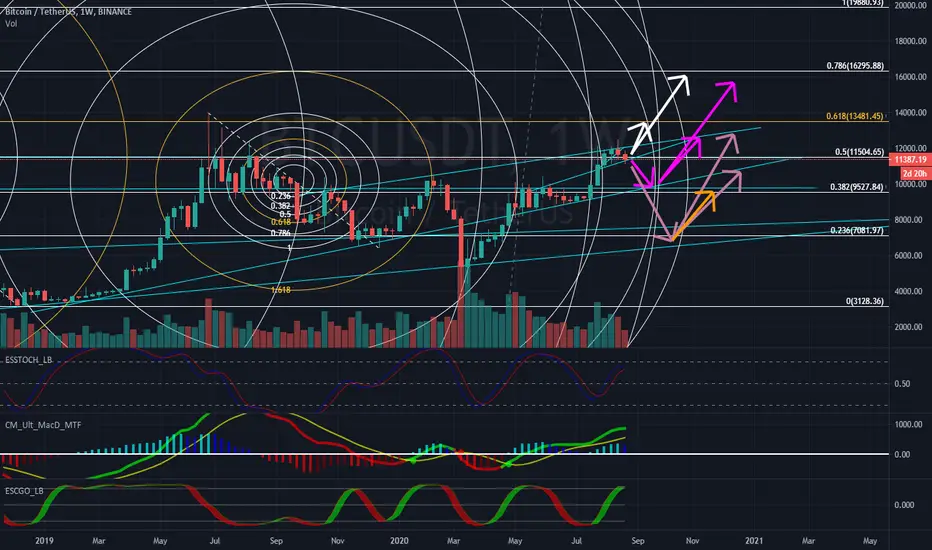
Currently we are either breaking out downward(weekly) or correcting back up into structure(via daily). The weekly candle close will determine is we have broken out of the current structure downward; however, BTC is currently correcting back into the structure as the weekly close approaches.
Weekly indicators:
IF weekly downward breakout holds until close.
Pink: Most plausible in my opinion.
Burnt Orange: Second most plausible according to indicators.
Daily Indicators:
IF weekly closes inside the structure.
White: Looking at the daily this seems to be a fairly likely outcome.
I apologize that my work is messy! Any feedback is appreciated and I hope this helps someone!!
Note: Arrows are not drawn to scale with respect to time, just a general guess of the path it will take price wise.
註釋
Seems to be following the expected path. (Pink)
免責聲明
這些資訊和出版物並非旨在提供,也不構成TradingView提供或認可的任何形式的財務、投資、交易或其他類型的建議或推薦。請閱讀使用條款以了解更多資訊。