
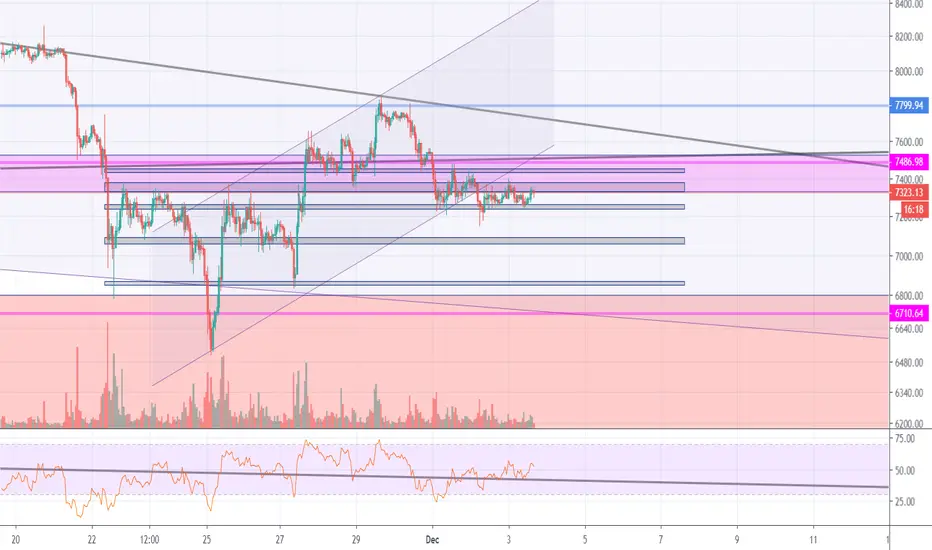
Hey, everybody, I'm the developer of an artificial intelligence buy-sell robot called Mikabot. In the light of the information provided by the new "Channel Bender" module, I added dark horizontal areas to the chart.
You see the dark horizontal areas in the graph.
These areas work as a trend and are the resistance and support of the channels.
The price of Bitcoin will probably find the new direction trapped between these trends.
Let's see what happens.
You see the dark horizontal areas in the graph.
These areas work as a trend and are the resistance and support of the channels.
The price of Bitcoin will probably find the new direction trapped between these trends.
Let's see what happens.

免責聲明
這些資訊和出版物並非旨在提供,也不構成TradingView提供或認可的任何形式的財務、投資、交易或其他類型的建議或推薦。請閱讀使用條款以了解更多資訊。