
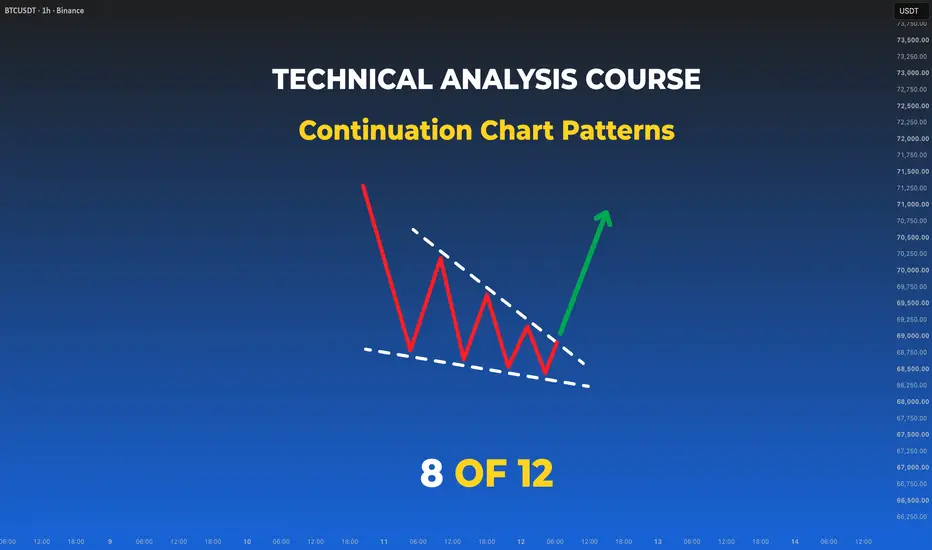
Lesson 8 - Continuation Chart Patterns: When Trends Pause
Difficulty: (Beginner–Intermediate)
Trends rarely move in straight lines. They pause, consolidate, and continue. Continuation patterns are the shapes that form during those pauses — Flags, Pennants, Triangles, Rectangles, and Wedges. Learning to identify them can help you enter trend-following trades with clearer context and more defined risk.

🔵 RECAP — WHERE WE LEFT OFF
In Lesson 7, you learned reversal patterns — the shapes that often mark the end of a trend. Now we cover their counterpart: patterns that form inside an existing trend and often precede continuation of the same direction.
🔵 WHY CONTINUATION PATTERNS MATTER
Every strong trend has periods of consolidation — moments where price catches its breath before extending. These consolidations are not random. They often form specific, recognizable shapes.
Recognizing these shapes can help you:
🐳 Pro Tip: Continuation patterns are only meaningful inside a clear trend. In a range or choppy market, they lose most of their reliability.
🔵 1. FLAGS — THE MOST COMMON CONTINUATION SHAPE
A Flag is a short, tight consolidation that leans against the trend direction.

Bull Flag: a sharp rally (the "pole"), followed by a small downward-sloping channel (the "flag"). Often precedes another leg up.
Bear Flag: mirror image. A sharp drop, followed by a small upward-sloping channel, often preceding another leg down.
Confirmation: a decisive close beyond the flag's boundary in the trend direction.
Target (measured move): the length of the pole projected from the breakout point.
Below is a real Bear Flag example on BTC — a sharp decline followed by a rising channel consolidation, then continuation of the downtrend.

🐳 Pro Tip: Flags that consolidate for too long can lose momentum. The cleanest Flags typically resolve within a few candles.
🔵 2. PENNANTS — THE SYMMETRIC COUSIN OF FLAGS
A Pennant is similar to a Flag, but the consolidation forms a small symmetric triangle instead of a channel.
Bull Pennant: sharp rally + small symmetric triangle + continuation up.
Bear Pennant: sharp drop + small symmetric triangle + continuation down.
Confirmation and targets follow the same logic as Flags.
🐳 Pro Tip: Flags and Pennants often signal the same continuation. The difference is cosmetic — the shape of the consolidation, not the outcome.
🔵 3. TRIANGLES — THREE VARIATIONS
Triangles are longer consolidations built by two converging trendlines.

Symmetric Triangle: two trendlines converging at the same rate — one connecting lower highs, one connecting higher lows. Breakout direction is not predetermined; the market often continues in the direction of the prior trend.
Ascending Triangle: a flat resistance line above, a rising support line below. Often precedes a bullish breakout, especially inside an existing uptrend.

Descending Triangle: mirror image. Flat support below, falling resistance above. Often precedes a bearish breakdown, especially inside an existing downtrend.
Confirmation: a decisive close beyond one of the triangle's boundaries with follow-through.
Target (measured move): the height of the triangle at its widest point, projected from the breakout.
🐳 Pro Tip: Triangles that break too close to their apex tend to be less reliable. The strongest breakouts often occur around the 2/3 mark of the triangle's length.
🔵 4. RECTANGLES — TRADING THE RANGE
A Rectangle is a horizontal consolidation between two parallel levels — essentially a mini-range inside a trend.

Bullish Rectangle: forms inside an uptrend. Price consolidates sideways before continuing up.
Bearish Rectangle: forms inside a downtrend. Price consolidates sideways before continuing down.
Confirmation: a decisive close beyond the rectangle's boundary in the trend direction.
Target (measured move): the height of the rectangle projected from the breakout.
🐳 Pro Tip: While consolidating, a Rectangle can be traded as a range (buy support, sell resistance) — until the eventual breakout.
🔵 5. WEDGES — RISING AND FALLING
Wedges look like triangles but slope in one clear direction. Their meaning depends on where they form.

Rising Wedge (Bearish): both trendlines slope up, but the upper one flattens. Often precedes a bearish breakdown — especially at the end of an uptrend or during a bounce inside a downtrend.
Falling Wedge (Bullish): both trendlines slope down, but the lower one flattens. Often precedes a bullish breakout — especially at the end of a downtrend or during a pullback inside an uptrend.
🐳 Pro Tip: Wedges are a case where a "continuation shape" often signals a reversal instead. Context decides — always check the higher-timeframe trend.
🔵 6. HOW TO TRADE CONTINUATION PATTERNS
The universal 4-step process:
Stop loss: just beyond the opposite boundary of the pattern.
Target: measured move from the pattern's height (or the pole, for Flags/Pennants).
🔵 7. COMMON BEGINNER MISTAKES
🔵 8. YOUR CONTINUATION FRAMEWORK
Before acting on any continuation pattern, ask:
🔵 QUICK SELF-CHECK
🔵 WHAT IS NEXT
Lesson 9 — Volume Analysis: we add a completely new dimension to price action. Volume tells you how much conviction is behind a move — and can help confirm whether a breakout is real or fading. We will cover volume spikes, divergences, climax volume, and how to use Volume Profile.
Drop a comment: which continuation pattern do you trade most often — Flag, Triangle, or Wedge?
Full Trading Roadmap | Classical TA Course
Trading Roadmap | Classical TA · Lesson 01 — Mastering the Chart
Trading Roadmap | Classical TA · Lesson 02 — Mastering Trends
Trading Roadmap | Classical TA · Lesson 03 — Support & Resistance
Trading Roadmap | Classical TA · Lesson 04 — Price Channels
Trading Roadmap | Classical TA · Lesson 05 — Single Candle Patterns
Trading Roadmap | Classical TA · Lesson 06 — Multi-Candle Patterns
Trading Roadmap | Classical TA · Lesson 07 — Reversal Chart Patterns
Best Regards, BigBeluga 🐳
Difficulty: (Beginner–Intermediate)
Trends rarely move in straight lines. They pause, consolidate, and continue. Continuation patterns are the shapes that form during those pauses — Flags, Pennants, Triangles, Rectangles, and Wedges. Learning to identify them can help you enter trend-following trades with clearer context and more defined risk.
🔵 RECAP — WHERE WE LEFT OFF
In Lesson 7, you learned reversal patterns — the shapes that often mark the end of a trend. Now we cover their counterpart: patterns that form inside an existing trend and often precede continuation of the same direction.
🔵 WHY CONTINUATION PATTERNS MATTER
Every strong trend has periods of consolidation — moments where price catches its breath before extending. These consolidations are not random. They often form specific, recognizable shapes.
Recognizing these shapes can help you:
- Enter trend-following trades with better structure
- Define your risk with clearer stop placement
- Set targets using measured moves
🐳 Pro Tip: Continuation patterns are only meaningful inside a clear trend. In a range or choppy market, they lose most of their reliability.
🔵 1. FLAGS — THE MOST COMMON CONTINUATION SHAPE
A Flag is a short, tight consolidation that leans against the trend direction.
Bull Flag: a sharp rally (the "pole"), followed by a small downward-sloping channel (the "flag"). Often precedes another leg up.
Bear Flag: mirror image. A sharp drop, followed by a small upward-sloping channel, often preceding another leg down.
Confirmation: a decisive close beyond the flag's boundary in the trend direction.
Target (measured move): the length of the pole projected from the breakout point.
Below is a real Bear Flag example on BTC — a sharp decline followed by a rising channel consolidation, then continuation of the downtrend.
🐳 Pro Tip: Flags that consolidate for too long can lose momentum. The cleanest Flags typically resolve within a few candles.
🔵 2. PENNANTS — THE SYMMETRIC COUSIN OF FLAGS
A Pennant is similar to a Flag, but the consolidation forms a small symmetric triangle instead of a channel.
Bull Pennant: sharp rally + small symmetric triangle + continuation up.
Bear Pennant: sharp drop + small symmetric triangle + continuation down.
Confirmation and targets follow the same logic as Flags.
🐳 Pro Tip: Flags and Pennants often signal the same continuation. The difference is cosmetic — the shape of the consolidation, not the outcome.
🔵 3. TRIANGLES — THREE VARIATIONS
Triangles are longer consolidations built by two converging trendlines.
Symmetric Triangle: two trendlines converging at the same rate — one connecting lower highs, one connecting higher lows. Breakout direction is not predetermined; the market often continues in the direction of the prior trend.
Ascending Triangle: a flat resistance line above, a rising support line below. Often precedes a bullish breakout, especially inside an existing uptrend.
Descending Triangle: mirror image. Flat support below, falling resistance above. Often precedes a bearish breakdown, especially inside an existing downtrend.
Confirmation: a decisive close beyond one of the triangle's boundaries with follow-through.
Target (measured move): the height of the triangle at its widest point, projected from the breakout.
🐳 Pro Tip: Triangles that break too close to their apex tend to be less reliable. The strongest breakouts often occur around the 2/3 mark of the triangle's length.
🔵 4. RECTANGLES — TRADING THE RANGE
A Rectangle is a horizontal consolidation between two parallel levels — essentially a mini-range inside a trend.
Bullish Rectangle: forms inside an uptrend. Price consolidates sideways before continuing up.
Bearish Rectangle: forms inside a downtrend. Price consolidates sideways before continuing down.
Confirmation: a decisive close beyond the rectangle's boundary in the trend direction.
Target (measured move): the height of the rectangle projected from the breakout.
🐳 Pro Tip: While consolidating, a Rectangle can be traded as a range (buy support, sell resistance) — until the eventual breakout.
🔵 5. WEDGES — RISING AND FALLING
Wedges look like triangles but slope in one clear direction. Their meaning depends on where they form.
Rising Wedge (Bearish): both trendlines slope up, but the upper one flattens. Often precedes a bearish breakdown — especially at the end of an uptrend or during a bounce inside a downtrend.
Falling Wedge (Bullish): both trendlines slope down, but the lower one flattens. Often precedes a bullish breakout — especially at the end of a downtrend or during a pullback inside an uptrend.
🐳 Pro Tip: Wedges are a case where a "continuation shape" often signals a reversal instead. Context decides — always check the higher-timeframe trend.
🔵 6. HOW TO TRADE CONTINUATION PATTERNS
The universal 4-step process:
- Confirm the prior trend — continuation patterns need a trend to continue
- Identify the consolidation shape and draw its boundaries
- Wait for a decisive close beyond the boundary in the trend direction
- Choose your entry style:
- Aggressive traders may enter on the breakout candle close
- Conservative traders often wait for a retest of the broken boundary
Stop loss: just beyond the opposite boundary of the pattern.
Target: measured move from the pattern's height (or the pole, for Flags/Pennants).
🔵 7. COMMON BEGINNER MISTAKES
- Trading continuation patterns in a range or trendless market
- Anticipating the breakout instead of waiting for the close
- Forcing a pattern where the boundaries don't cleanly fit
- Confusing a Bear Flag inside a downtrend with a bullish reversal
- Ignoring volume — many breakouts fail on low volume
- Not deciding whether you're playing the break or the retest
🔵 8. YOUR CONTINUATION FRAMEWORK
Before acting on any continuation pattern, ask:
- Is there a clear trend before this consolidation?
- Does the pattern's boundaries fit the price action cleanly?
- Has price closed decisively beyond the boundary?
- What is the measured target, and does it justify the risk?
🔵 QUICK SELF-CHECK
- Identify a Bull Flag vs a Bear Flag
- Distinguish a Pennant from a Symmetric Triangle
- Explain when to expect a bullish vs bearish break from a Symmetric Triangle
- Recognize a Falling Wedge and know why it often signals a bullish break
- Measure a target using the pole (Flag) or the triangle's height
🔵 WHAT IS NEXT
Lesson 9 — Volume Analysis: we add a completely new dimension to price action. Volume tells you how much conviction is behind a move — and can help confirm whether a breakout is real or fading. We will cover volume spikes, divergences, climax volume, and how to use Volume Profile.
Drop a comment: which continuation pattern do you trade most often — Flag, Triangle, or Wedge?
Full Trading Roadmap | Classical TA Course
Trading Roadmap | Classical TA · Lesson 01 — Mastering the Chart
Trading Roadmap | Classical TA · Lesson 02 — Mastering Trends
Trading Roadmap | Classical TA · Lesson 03 — Support & Resistance
Trading Roadmap | Classical TA · Lesson 04 — Price Channels
Trading Roadmap | Classical TA · Lesson 05 — Single Candle Patterns
Trading Roadmap | Classical TA · Lesson 06 — Multi-Candle Patterns
Trading Roadmap | Classical TA · Lesson 07 — Reversal Chart Patterns
Best Regards, BigBeluga 🐳

🔵Gain access to our powerful tools : bigbeluga.com/tv
🔵Join our free discord for updates : discord.com/invite/FuW63RKgdc
All scripts & content provided by BigBeluga are for informational & educational purposes only.
🔵Join our free discord for updates : discord.com/invite/FuW63RKgdc
All scripts & content provided by BigBeluga are for informational & educational purposes only.
相關出版品
免責聲明
這些資訊和出版物並非旨在提供,也不構成TradingView提供或認可的任何形式的財務、投資、交易或其他類型的建議或推薦。請閱讀使用條款以了解更多資訊。
🔵Gain access to our powerful tools : bigbeluga.com/tv
🔵Join our free discord for updates : discord.com/invite/FuW63RKgdc
All scripts & content provided by BigBeluga are for informational & educational purposes only.
🔵Join our free discord for updates : discord.com/invite/FuW63RKgdc
All scripts & content provided by BigBeluga are for informational & educational purposes only.
相關出版品
免責聲明
這些資訊和出版物並非旨在提供,也不構成TradingView提供或認可的任何形式的財務、投資、交易或其他類型的建議或推薦。請閱讀使用條款以了解更多資訊。