
Hey Realistic Traders!
Why do I think the sharp decline in Bitcoin isn’t over yet?
Let’s dive into the technical analysis to answer this question and see what the price action is actually signaling.
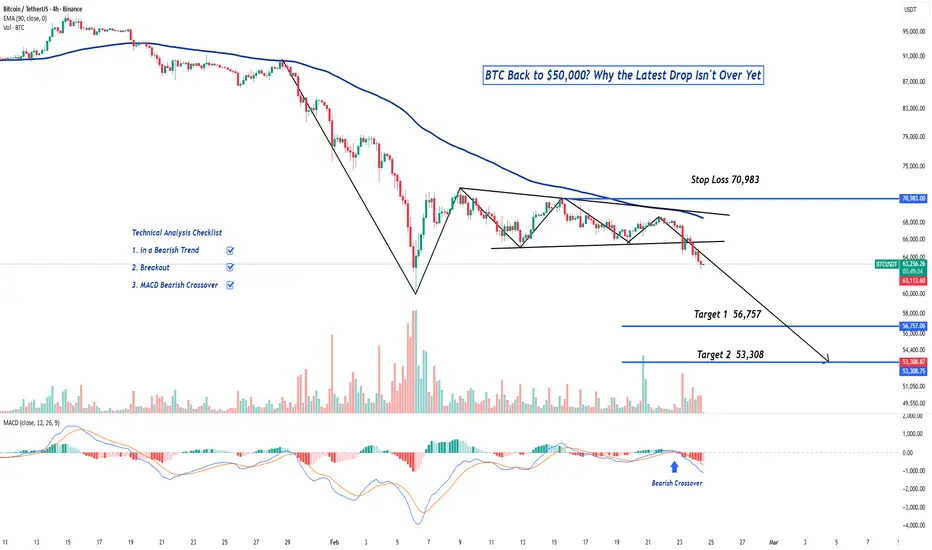
On the H4 timeframe, BTCUSDT has consistently traded below the EMA90 line, reinforcing the strength of the current bearish trend. During this decline, the price entered a phase of consolidation, forming a symmetrical triangle pattern just below the dynamic resistance of the EMA. While these patterns represent market indecision, a breakdown to the downside typically signals a continuation of the prevailing trend.
The subsequent breakdown from this triangle confirms renewed selling pressure and likely marks the beginning of a new impulsive downward movement. Furthermore, a bearish MACD crossover has occurred, providing critical secondary confirmation that momentum is shifting further in favor of the bears.
Based on this confluence of signals, we have determined target levels at key historical support zones. Target 1 is set at 56,757, with a potential extension toward Target 2 at 53,308. Given the significance of these historical levels, we may see a substantial rebound once the price reaches this area.
This bearish outlook remains valid as long as Bitcoin stays below our stop-loss level at 70,983. A daily close above this mark would break the current market structure and invalidate this analysis.
Support the channel by engaging with the content, hitting the rocket button, and sharing your opinions in the comments below! 🚀
Disclaimer: All content provided here is for informational and educational purposes and should not be construed as professional financial, investment, or legal advice. Cryptocurrency trading carries a high level of risk and may not be suitable for all investors.
Why do I think the sharp decline in Bitcoin isn’t over yet?
Let’s dive into the technical analysis to answer this question and see what the price action is actually signaling.
On the H4 timeframe, BTCUSDT has consistently traded below the EMA90 line, reinforcing the strength of the current bearish trend. During this decline, the price entered a phase of consolidation, forming a symmetrical triangle pattern just below the dynamic resistance of the EMA. While these patterns represent market indecision, a breakdown to the downside typically signals a continuation of the prevailing trend.
The subsequent breakdown from this triangle confirms renewed selling pressure and likely marks the beginning of a new impulsive downward movement. Furthermore, a bearish MACD crossover has occurred, providing critical secondary confirmation that momentum is shifting further in favor of the bears.
Based on this confluence of signals, we have determined target levels at key historical support zones. Target 1 is set at 56,757, with a potential extension toward Target 2 at 53,308. Given the significance of these historical levels, we may see a substantial rebound once the price reaches this area.
This bearish outlook remains valid as long as Bitcoin stays below our stop-loss level at 70,983. A daily close above this mark would break the current market structure and invalidate this analysis.
Support the channel by engaging with the content, hitting the rocket button, and sharing your opinions in the comments below! 🚀
Disclaimer: All content provided here is for informational and educational purposes and should not be construed as professional financial, investment, or legal advice. Cryptocurrency trading carries a high level of risk and may not be suitable for all investors.
交易進行
We maintain the bearish outlook on BTCUSDT- The lack of catalyst for reversal
- People didn't buy the digital gold narrative anymore
- Investors focus more on commodities and precious metal to hedge their money through digital or physical products.

相關出版品
免責聲明
這些資訊和出版物並非旨在提供,也不構成TradingView提供或認可的任何形式的財務、投資、交易或其他類型的建議或推薦。請閱讀使用條款以了解更多資訊。