
📉🐻 BTC/USDT Daily Chart Analysis – Bearish Breakdown & Reversal Zone
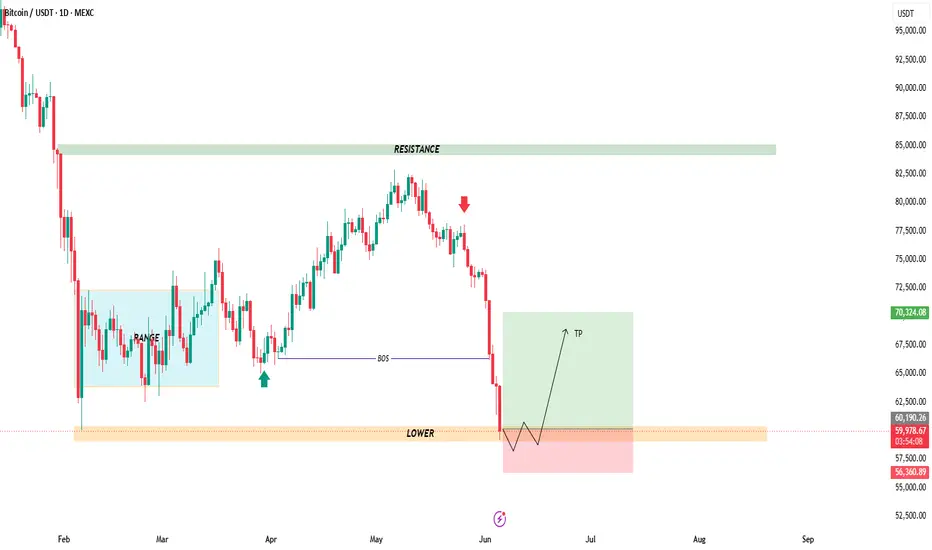
The BTC/USDT daily chart shows a strong bearish market structure after failing to sustain higher prices near the $80K–82K resistance area. Sellers stepped in aggressively, leading to a sharp decline and a break below the previous BOS (Break of Structure) level.
🔍 Key Technical Observations
✅ Major Resistance: $84K–85K zone remains the key supply area where sellers previously rejected price.
✅ Bearish Momentum: Consecutive strong bearish candles indicate high selling pressure and market weakness.
✅ Liquidity Zone Reached: Price has dropped into the highlighted lower support/demand zone around $60K, an area where buyers may attempt to defend.
✅ Potential Reversal Setup: The chart suggests a possible liquidity sweep below support before a bullish recovery. A successful hold above this demand zone could trigger a rebound.
📊 Trading Outlook
🔻 Bearish Scenario: A daily close below the support zone may extend the decline toward $56K–57K.
🔺 Bullish Scenario: If buyers defend the current demand area, BTC could form a base and rally toward $68K–70K, matching the projected target zone.
🎯 Conclusion
The overall trend remains bearish in the short term, but BTC is approaching a critical demand area where a short-term bullish reaction could emerge. Traders should watch for confirmation before entering long positions. 🚀📈
The BTC/USDT daily chart shows a strong bearish market structure after failing to sustain higher prices near the $80K–82K resistance area. Sellers stepped in aggressively, leading to a sharp decline and a break below the previous BOS (Break of Structure) level.
🔍 Key Technical Observations
✅ Major Resistance: $84K–85K zone remains the key supply area where sellers previously rejected price.
✅ Bearish Momentum: Consecutive strong bearish candles indicate high selling pressure and market weakness.
✅ Liquidity Zone Reached: Price has dropped into the highlighted lower support/demand zone around $60K, an area where buyers may attempt to defend.
✅ Potential Reversal Setup: The chart suggests a possible liquidity sweep below support before a bullish recovery. A successful hold above this demand zone could trigger a rebound.
📊 Trading Outlook
🔻 Bearish Scenario: A daily close below the support zone may extend the decline toward $56K–57K.
🔺 Bullish Scenario: If buyers defend the current demand area, BTC could form a base and rally toward $68K–70K, matching the projected target zone.
🎯 Conclusion
The overall trend remains bearish in the short term, but BTC is approaching a critical demand area where a short-term bullish reaction could emerge. Traders should watch for confirmation before entering long positions. 🚀📈
交易進行
📉 **BTCUSDT Trade Update – Bearish Scenario Playing Out** 🎯
✅ Price respected the bearish market structure and broke below key support.
📊 Momentum remains strong to the downside, with sellers firmly in control.
🎯 The trade is moving according to plan and progressing toward the target zone.
🧠 **Patience pays — let the setup work.** 🔥

✦ MARKET STRATEGY SIGNALS ✦ 📊
Smart Money • Price Action • Precision • good entries
📲 Join Telegram: t.me/marketstrategyentry
Smart Money • Price Action • Precision • good entries
📲 Join Telegram: t.me/marketstrategyentry
相關出版品
免責聲明
這些資訊和出版物並非旨在提供,也不構成TradingView提供或認可的任何形式的財務、投資、交易或其他類型的建議或推薦。請閱讀使用條款以了解更多資訊。
✦ MARKET STRATEGY SIGNALS ✦ 📊
Smart Money • Price Action • Precision • good entries
📲 Join Telegram: t.me/marketstrategyentry
Smart Money • Price Action • Precision • good entries
📲 Join Telegram: t.me/marketstrategyentry
相關出版品
免責聲明
這些資訊和出版物並非旨在提供,也不構成TradingView提供或認可的任何形式的財務、投資、交易或其他類型的建議或推薦。請閱讀使用條款以了解更多資訊。