
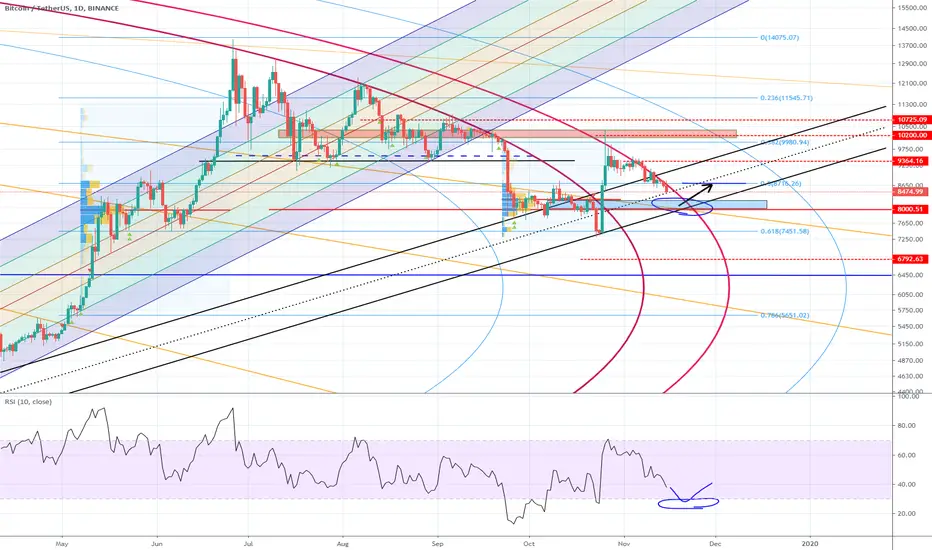
Using a number of sources, it seems the area marked (btw 8000 to 8300) can potentially be a good entry point for a $700 gain.
Reasons:
> Previous resistance and then support range
> Buying Volume average (strong support) in May-June was $8000
> Buying volume average in late Sept to mid October was $8300
> Psychological number, $8000
> Fib Fan support line
> Bottom support base trend line
> Fib, Circle acting as resistance could potentially be broken here
> Seems to be equating bottom of RSI and stochastic indicators on the daily chart
> Confluence with weekly 50 EMA range
Also fits into the Macro going long formation as per this post

Weekly chart

Reasons:
> Previous resistance and then support range
> Buying Volume average (strong support) in May-June was $8000
> Buying volume average in late Sept to mid October was $8300
> Psychological number, $8000
> Fib Fan support line
> Bottom support base trend line
> Fib, Circle acting as resistance could potentially be broken here
> Seems to be equating bottom of RSI and stochastic indicators on the daily chart
> Confluence with weekly 50 EMA range
Also fits into the Macro going long formation as per this post
Weekly chart
註釋
Looking at the chart today, still not comfortable to go in.I would like to see a open and close candle above the daily 50 MA.
註釋
Using fib circle, we can observe the real wedge pattern. Still within the formation 註釋
Still patiently waiting註釋
Referring to the RSI, Stochastic, its not low enough which I thought would equate to this region. Hence I'm looking towards a slightly lower price. 7570-7770註釋

Discord: discord.com/invite/vb4hbP88vb (TradeToProspa)
Telegram: t.me/TprospaTradersbot
This community has signals now but with no risk management comms.
Telegram: t.me/TprospaTradersbot
This community has signals now but with no risk management comms.
相關出版品
免責聲明
這些資訊和出版物並非旨在提供,也不構成TradingView提供或認可的任何形式的財務、投資、交易或其他類型的建議或推薦。請閱讀使用條款以了解更多資訊。
Discord: discord.com/invite/vb4hbP88vb (TradeToProspa)
Telegram: t.me/TprospaTradersbot
This community has signals now but with no risk management comms.
Telegram: t.me/TprospaTradersbot
This community has signals now but with no risk management comms.
相關出版品
免責聲明
這些資訊和出版物並非旨在提供,也不構成TradingView提供或認可的任何形式的財務、投資、交易或其他類型的建議或推薦。請閱讀使用條款以了解更多資訊。