
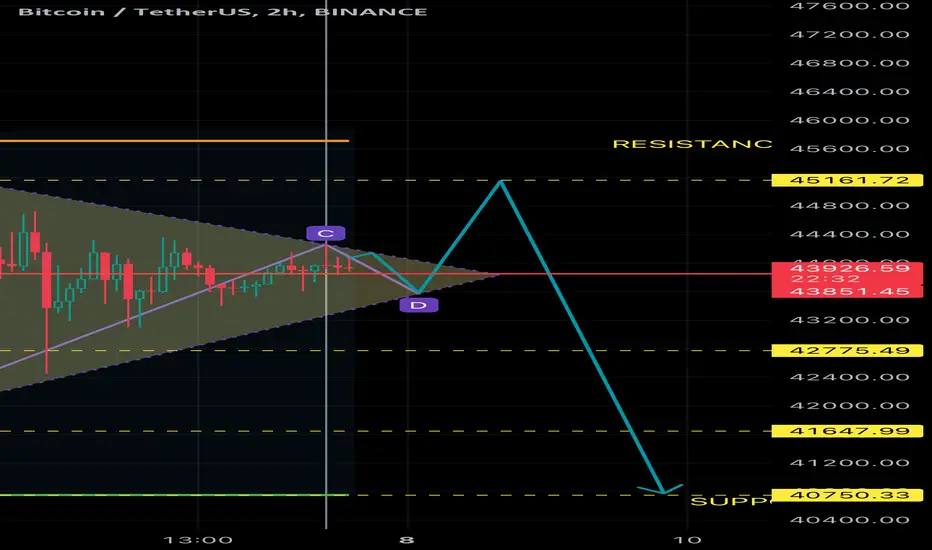
Using the peak of our latest high we can form a triangle that has not been broken out of. The volume profile aligns with the centre of the triangle and provides another line of resistance if BTC breaks up. Similarly the volume shows us how BTC might have multiple areas of resistance of it the breaks down. You’re welcome!

免責聲明
這些資訊和出版物並非旨在提供,也不構成TradingView提供或認可的任何形式的財務、投資、交易或其他類型的建議或推薦。請閱讀使用條款以了解更多資訊。
免責聲明
這些資訊和出版物並非旨在提供,也不構成TradingView提供或認可的任何形式的財務、投資、交易或其他類型的建議或推薦。請閱讀使用條款以了解更多資訊。