#BTC/USDT
short-term analysis.
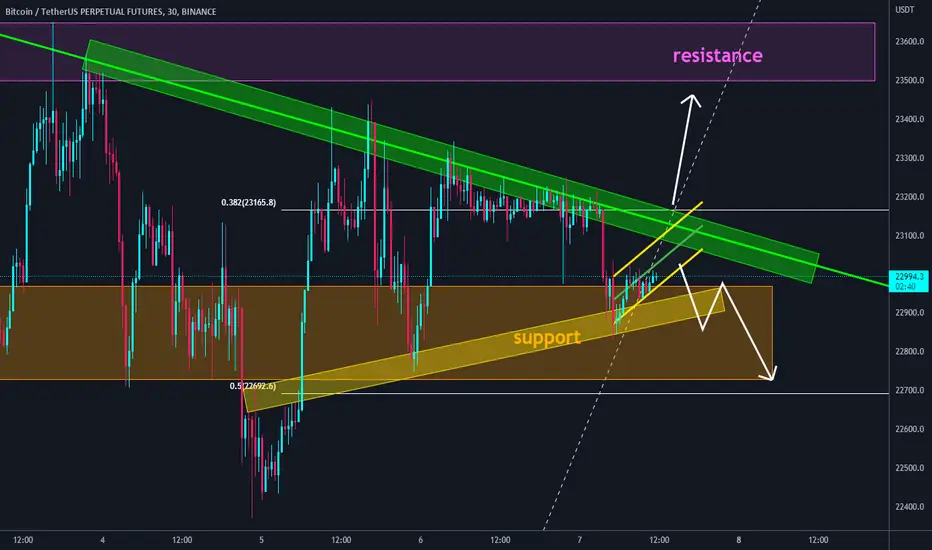
 BTC is inside a symmetrical triangle between 0.5 and 0.386 fib levels of the last swing high.
🐻 bearish flag can drop price to break out from lower line toward 0.5 fib level at $22700.
🐮 the upper line of flag is the same with descending resistance zone, that makes this zone strong.
BTW if price breaks out from this zone price possible to move up toward resistance zone above $23500.
short-term analysis.
BTC is inside a symmetrical triangle between 0.5 and 0.386 fib levels of the last swing high.🐻 bearish flag can drop price to break out from lower line toward 0.5 fib level at $22700.
🐮 the upper line of flag is the same with descending resistance zone, that makes this zone strong.
BTW if price breaks out from this zone price possible to move up toward resistance zone above $23500.

相關出版品
免責聲明
這些資訊和出版物並非旨在提供,也不構成TradingView提供或認可的任何形式的財務、投資、交易或其他類型的建議或推薦。請閱讀使用條款以了解更多資訊。