
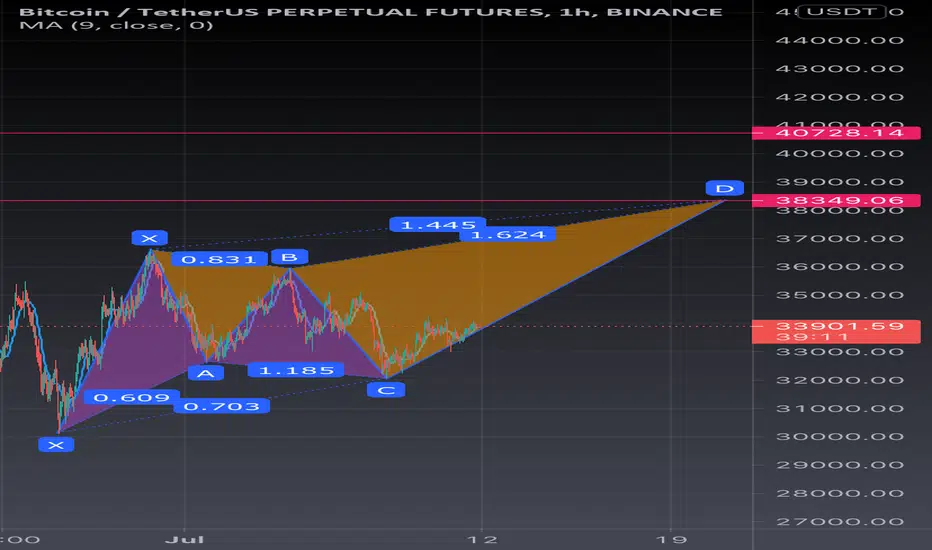
Let’s now see what the bearish Shark pattern appears like.
Below you can see an illustration of the bearish variety of the Shark pattern along with the key Fibonacci relationships within the structure.
bearish-shark-pattern
OX price leg – This is the initial bearish impulsive price move.
XA price leg – This leg retraces a portion of the initial OX leg.
AB price leg – This leg extends beyond the swing low at point X. Point B should terminate within the range of 113 to 161% of the XA leg.
BC price leg – As price moves higher, Point C should terminate at a level that corresponds to 161% to 224% projection of the XA leg. Moreover, point C should retrace to 88% to 113% of the OX leg.
Now let’s discuss the main Fibonacci relationships and trade management rules as it pertains to the bearish variety of the Shark pattern.
Below you can see an illustration of the bearish variety of the Shark pattern along with the key Fibonacci relationships within the structure.
bearish-shark-pattern
OX price leg – This is the initial bearish impulsive price move.
XA price leg – This leg retraces a portion of the initial OX leg.
AB price leg – This leg extends beyond the swing low at point X. Point B should terminate within the range of 113 to 161% of the XA leg.
BC price leg – As price moves higher, Point C should terminate at a level that corresponds to 161% to 224% projection of the XA leg. Moreover, point C should retrace to 88% to 113% of the OX leg.
Now let’s discuss the main Fibonacci relationships and trade management rules as it pertains to the bearish variety of the Shark pattern.

免責聲明
這些資訊和出版物並非旨在提供,也不構成TradingView提供或認可的任何形式的財務、投資、交易或其他類型的建議或推薦。請閱讀使用條款以了解更多資訊。
免責聲明
這些資訊和出版物並非旨在提供,也不構成TradingView提供或認可的任何形式的財務、投資、交易或其他類型的建議或推薦。請閱讀使用條款以了解更多資訊。