
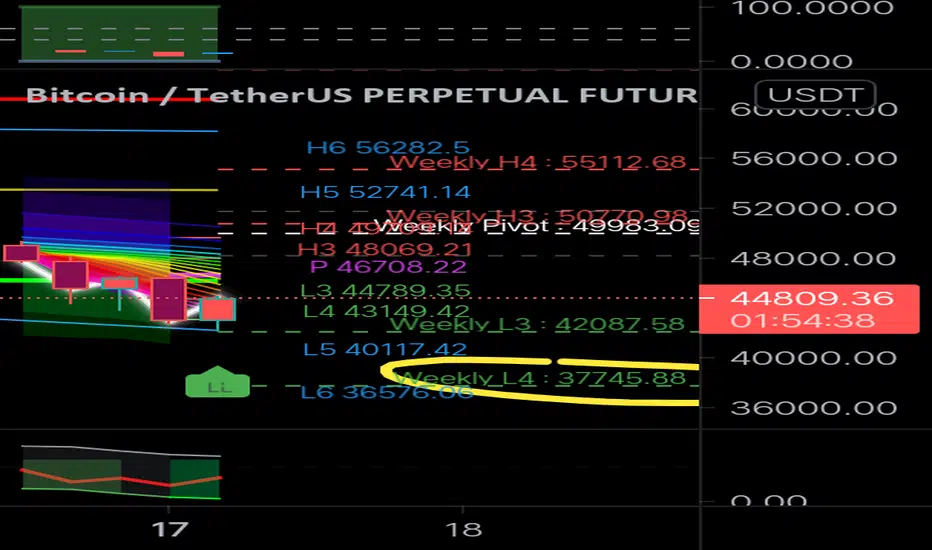
generally untested pivots on daily weekly and monthly get tested and on camarilla pivots generally the first move in new,levels to h3 or l3 are a fakeout and will at e very least the opposing range side. in camarilla pivots the h and l 3 levels represent prejected range top and bottom based on previous high low and open close for the levels being used. in this chart both the daily and weekly levels are shown. The level 4 represent breakout levels or stop loss levels and in this particular chart is the long stop loss area. Targets minimum are we test new central pivot range around 48 to 50 and then see about h3 to h6

免責聲明
這些資訊和出版物並非旨在提供,也不構成TradingView提供或認可的任何形式的財務、投資、交易或其他類型的建議或推薦。請閱讀使用條款以了解更多資訊。
免責聲明
這些資訊和出版物並非旨在提供,也不構成TradingView提供或認可的任何形式的財務、投資、交易或其他類型的建議或推薦。請閱讀使用條款以了解更多資訊。