 BTDR
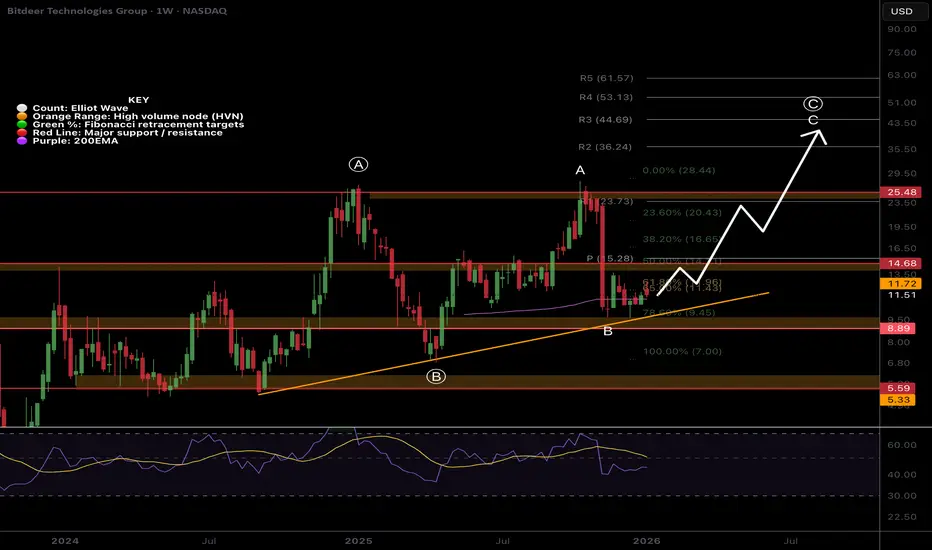
BTDR🎯 After a 500%+ rally to all-time high, BTDR gave back most of its gain in a single week, alongside Bitcoin, undoing all that hard work. Price is currently finding support just above the weekly 200EMA and low-cap golden pocket, 0.786 Fibonacci retracement. The macro structure is still bullish with a series of higher highs and higher lows. Wave C of (C) appears to be underway with a target of the R3 pivot at $44 once momentum to Bitcoin and AI returns. The weekly pivot is the next resistance, $15.
📈 Weekly RSI is below the EQ with plenty of room to fall until oversold, though historically it never quite reaches this low.
👉 Analysis is invalidated if price falls below wave (B), $6, and the structure will start to look bearish.
Safe trading

🎓 Behavioural Economist (PhD)
📈 Trader / Investor 15 years
👑 Unlock my trading plans: tradingblueprints.substack.com
🏆 Market Psychologist Newsletter: marketpsychologist.substack.com
📈 Trader / Investor 15 years
👑 Unlock my trading plans: tradingblueprints.substack.com
🏆 Market Psychologist Newsletter: marketpsychologist.substack.com
相關出版品
免責聲明
這些資訊和出版物並非旨在提供,也不構成TradingView提供或認可的任何形式的財務、投資、交易或其他類型的建議或推薦。請閱讀使用條款以了解更多資訊。
🎓 Behavioural Economist (PhD)
📈 Trader / Investor 15 years
👑 Unlock my trading plans: tradingblueprints.substack.com
🏆 Market Psychologist Newsletter: marketpsychologist.substack.com
📈 Trader / Investor 15 years
👑 Unlock my trading plans: tradingblueprints.substack.com
🏆 Market Psychologist Newsletter: marketpsychologist.substack.com
相關出版品
免責聲明
這些資訊和出版物並非旨在提供,也不構成TradingView提供或認可的任何形式的財務、投資、交易或其他類型的建議或推薦。請閱讀使用條款以了解更多資訊。