做多
BZRX/BTC
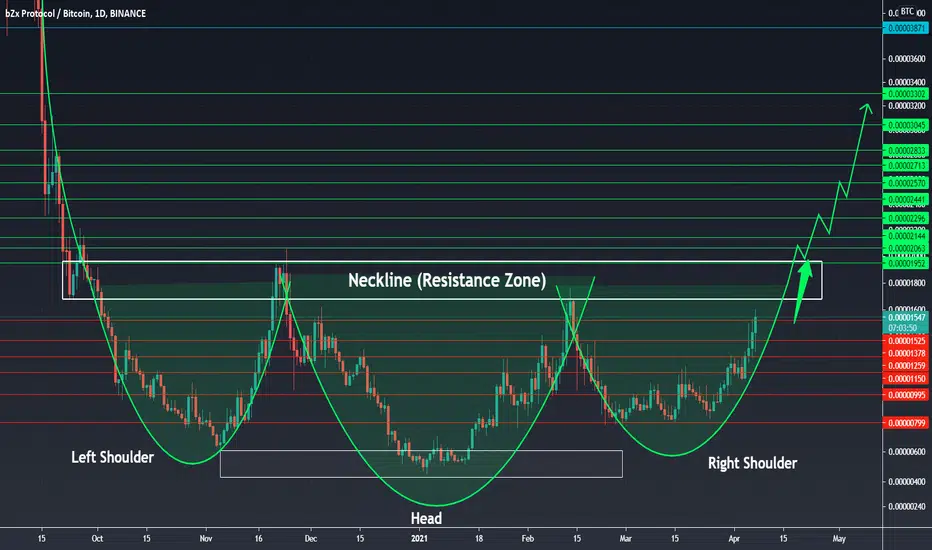
The chart says it all, bullish pattern Inverse Head & Shoulder predicts reversals in downtrend which it has been facing since the last drop in the price during Sept 2020. The final trough is being made and the price is heading upwards towards the Neckline (resistance zone) from where the BREAKOUT will start. All the targets are mentioned in green.
For educational purposes only (DYOR)
For educational purposes only (DYOR)

免責聲明
這些資訊和出版物並非旨在提供,也不構成TradingView提供或認可的任何形式的財務、投資、交易或其他類型的建議或推薦。請閱讀使用條款以了解更多資訊。