BZRX Break the Flag Pattern
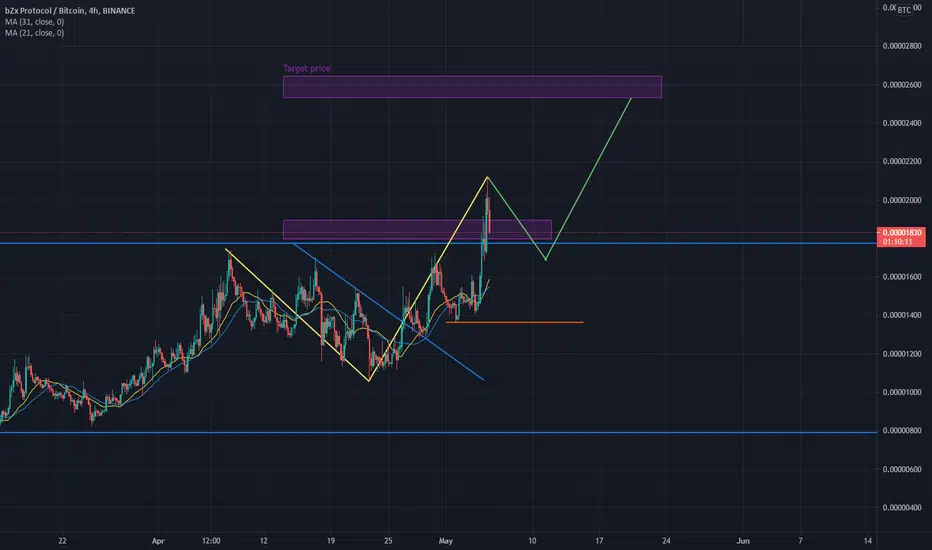
BZRX has been a long sideway after the bearish trend. I see a price that has been break the flag pattern and resistance, and most likely the price to go up. There is 2 purple area box that I draw above. The first box below it has touched the harmonic price, and the next will be the correction that I draw in the chart then after the correction was done. If it rises and breaks the resistance, it will most likely go up to the price of the second box area (0.000025xx-0.000026xx). if not, wait until the red line support hit

免責聲明
這些資訊和出版物並非旨在提供,也不構成TradingView提供或認可的任何形式的財務、投資、交易或其他類型的建議或推薦。請閱讀使用條款以了解更多資訊。