

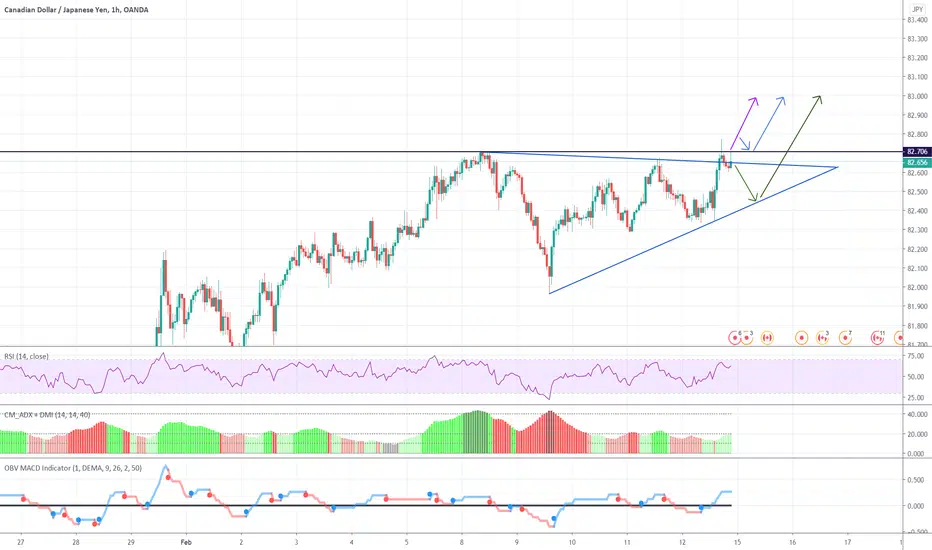
CADJPY possible long scenarios represented by the coloured arrows.
Scenario 1 (Green Arrow): we see a wedge pattern where it bounces of lower boundary to then make a move to the upside breaking out to resistance at 83.000 (psychological price level).
Scenario 2 (Blue Arrow): We see it break upper resistance (Black line), retest then move towards 83.000
Scenario 3: We watch for a breakout of upper resistance and a move towards 83.000
Looking at the moving average we see price in a upwards trend, hence the reason for not looking at taking a short
Scenario 1 (Green Arrow): we see a wedge pattern where it bounces of lower boundary to then make a move to the upside breaking out to resistance at 83.000 (psychological price level).
Scenario 2 (Blue Arrow): We see it break upper resistance (Black line), retest then move towards 83.000
Scenario 3: We watch for a breakout of upper resistance and a move towards 83.000
Looking at the moving average we see price in a upwards trend, hence the reason for not looking at taking a short
交易結束:目標達成
Fantastic trade here, broke out to the upside
免責聲明
這些資訊和出版物並非旨在提供,也不構成TradingView提供或認可的任何形式的財務、投資、交易或其他類型的建議或推薦。請閱讀使用條款以了解更多資訊。