做多
Cannabiscoin feuling up
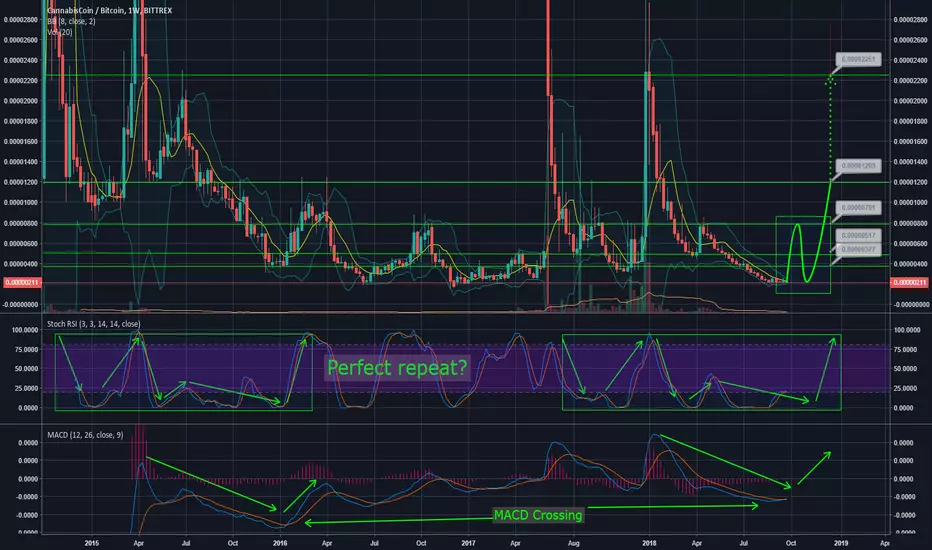
Just started looking at the weekly view and found a repeating pattern in the YTD chart of CANN.
Indicators
Fact
Chart is weekly view, have to give this trade some time to develop.
My Targets:
Mid term
- 377 Sat
- 517 Sat
- 791 Sat
When we look at the history of this coin, big pumps happen, targets (risky) here are:
- 1203
- 2270
- Up to 4500
This is no advice, just my tradesetup an why! DYOR and good luck!
Indicators
- MACD is rising and ready to cross on the weekly chart.
- RSI is making a repeating move to, you can see the repeating pattern in the green rectangles.
Fact
Chart is weekly view, have to give this trade some time to develop.
My Targets:
Mid term
- 377 Sat
- 517 Sat
- 791 Sat
When we look at the history of this coin, big pumps happen, targets (risky) here are:
- 1203
- 2270
- Up to 4500
This is no advice, just my tradesetup an why! DYOR and good luck!

免責聲明
這些資訊和出版物並非旨在提供,也不構成TradingView提供或認可的任何形式的財務、投資、交易或其他類型的建議或推薦。請閱讀使用條款以了解更多資訊。