
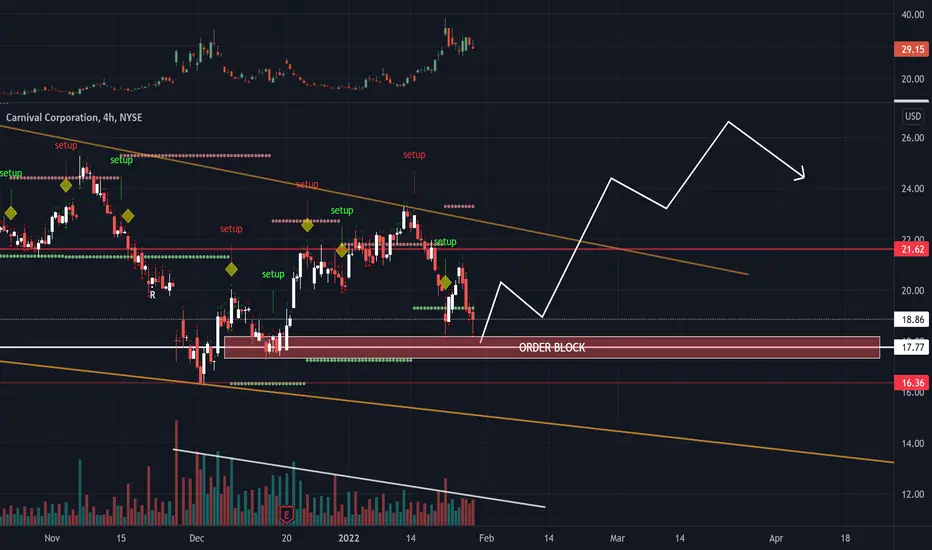
Just some basic technical analysis with the VIX chart at the top of the screen. As you may see, we are seeing a "double Bottom" which is a very bullish chart pattern. In conjunction with the VIX chart and the slowly decreasing Volume, it may be possible to see a reversal here on the next trading day. When we see more market participants buying then it would be safe to assume that there may be a possibility of market reversal.

免責聲明
這些資訊和出版物並非旨在提供,也不構成TradingView提供或認可的任何形式的財務、投資、交易或其他類型的建議或推薦。請閱讀使用條款以了解更多資訊。
免責聲明
這些資訊和出版物並非旨在提供,也不構成TradingView提供或認可的任何形式的財務、投資、交易或其他類型的建議或推薦。請閱讀使用條款以了解更多資訊。