做多
CEI
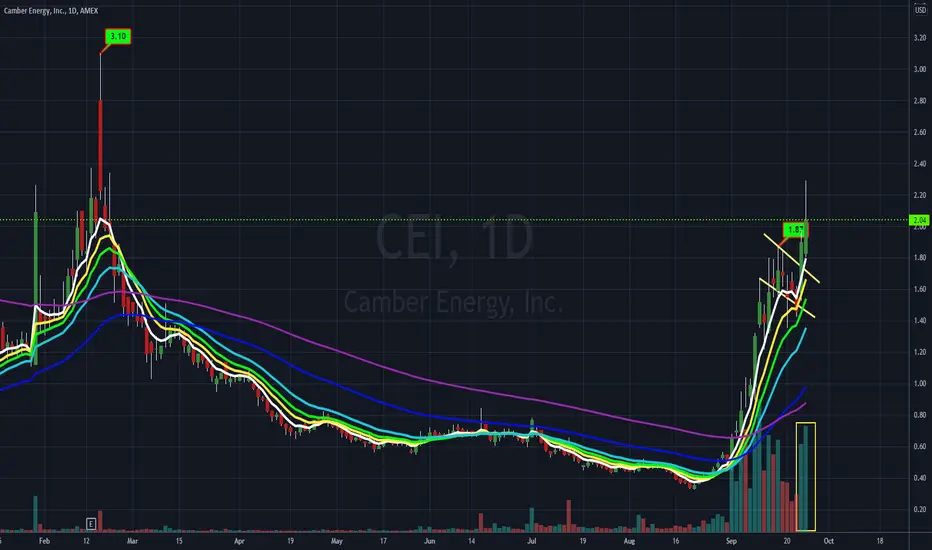
Camber Energy Inc (NYSEAMERICAN:CEI) broke through resistance and out of a small bullish flag formation last week. The technical daily chart above shows very strong upward momentum as the stock is above all the major moving averages with both 50-day EMA and 200-day exp moving averages going up. All indicators still point to a bull market. The next level to watch is Friday's high of 2.29, followed by 2.80. Support awaits at 1.81, a low point on Friday, followed by 1.70, which provided support on Thursday (EMA50). With the trend still up the bias is to the upside.

免責聲明
這些資訊和出版物並非旨在提供,也不構成TradingView提供或認可的任何形式的財務、投資、交易或其他類型的建議或推薦。請閱讀使用條款以了解更多資訊。