
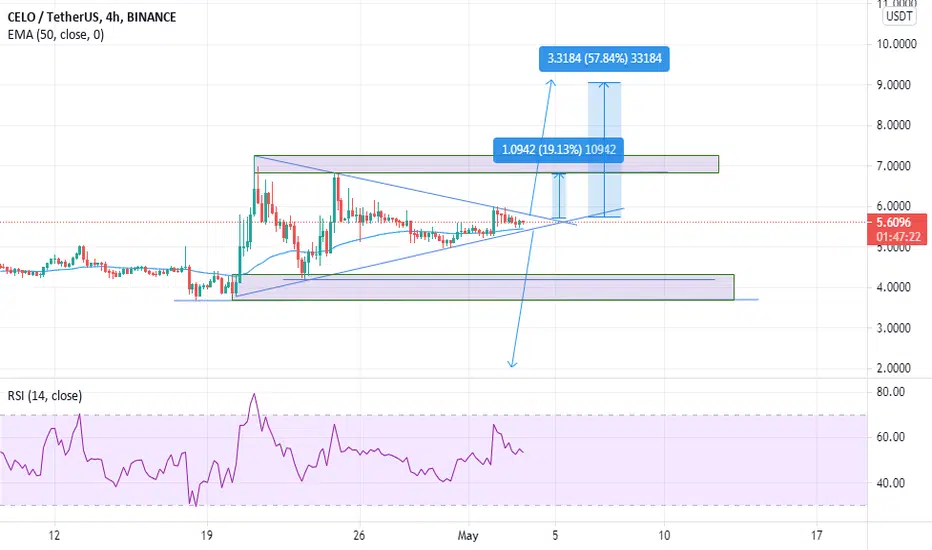
The chart is trapped between two trend lines,one ascending and one descending.With another attitude we can realize that the chart formed a triangle pattern.If the the chart breaks the higher side of the triangle,it is probable that it will go high as our target but we should be careful about those resistances.If it breaks the lower side it would go down but those supports may support the chart and that would make an opportunity to open a long position down there.

免責聲明
這些資訊和出版物並非旨在提供,也不構成TradingView提供或認可的任何形式的財務、投資、交易或其他類型的建議或推薦。請閱讀使用條款以了解更多資訊。
免責聲明
這些資訊和出版物並非旨在提供,也不構成TradingView提供或認可的任何形式的財務、投資、交易或其他類型的建議或推薦。請閱讀使用條款以了解更多資訊。