
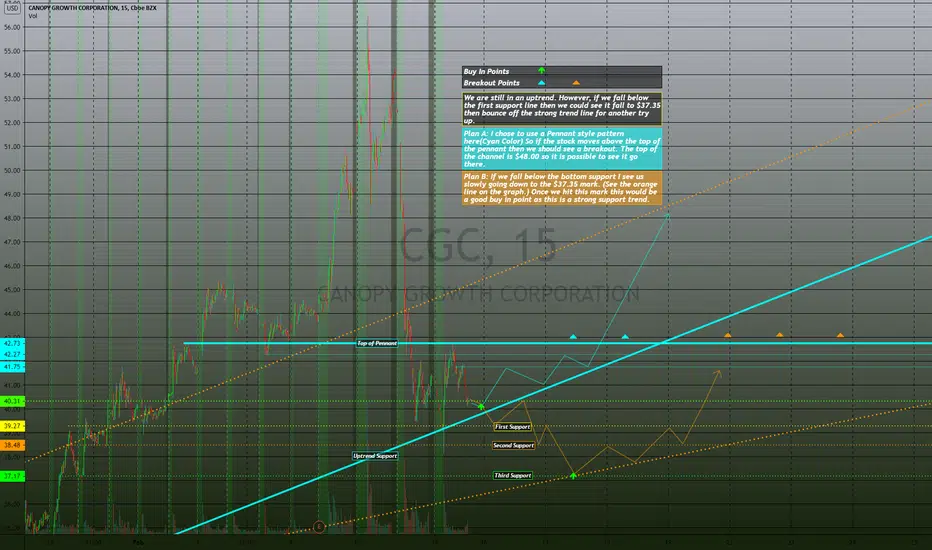
We are still in an uptrend. However, if we fall below the first support line then we could see it fall to $37.35 then bounce off the strong trend line for another try up.
Plan A: I chose to use a Pennant style pattern here(Cyan Color) So if the stock moves above the top of the pennant then we should see a breakout. The top of the channel is $48.00 so it is possible to see it go there.
Plan B: If we fall below the bottom support I see us slowly going down to the $37.35 mark. (See the orange line on the graph.) Once we hit this mark this would be a good buy in point as this is a strong support trend.
Plan A: I chose to use a Pennant style pattern here(Cyan Color) So if the stock moves above the top of the pennant then we should see a breakout. The top of the channel is $48.00 so it is possible to see it go there.
Plan B: If we fall below the bottom support I see us slowly going down to the $37.35 mark. (See the orange line on the graph.) Once we hit this mark this would be a good buy in point as this is a strong support trend.

免責聲明
這些資訊和出版物並非旨在提供,也不構成TradingView提供或認可的任何形式的財務、投資、交易或其他類型的建議或推薦。請閱讀使用條款以了解更多資訊。
免責聲明
這些資訊和出版物並非旨在提供,也不構成TradingView提供或認可的任何形式的財務、投資、交易或其他類型的建議或推薦。請閱讀使用條款以了解更多資訊。