
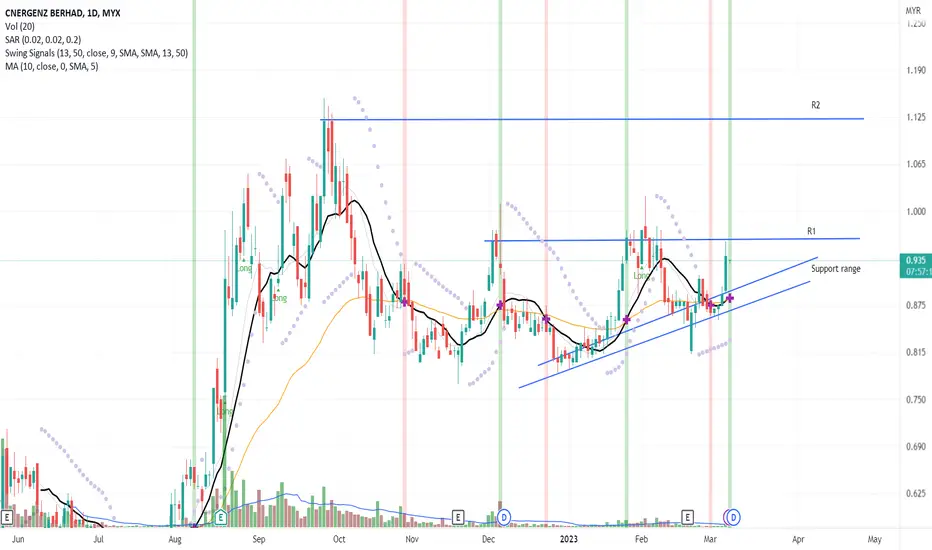
The candlestick pattern indicates the price has rebound from the price support range. Where the price gains momentum towards the R1. Although there was a significant price movement the result in volume is lower than the average volume. Hence, indicate an accumulated phase pattern but suggests that the long-term uptrend remains intact.
The MACD is in a divergence signal, thus, conforming with the candlestick trendline.
Let's save CNERGEN in WL and watch out for significant price movement with the volume above the average volume.
R 0.965
S 0.865
The MACD is in a divergence signal, thus, conforming with the candlestick trendline.
Let's save CNERGEN in WL and watch out for significant price movement with the volume above the average volume.
R 0.965
S 0.865

免責聲明
這些資訊和出版物並非旨在提供,也不構成TradingView提供或認可的任何形式的財務、投資、交易或其他類型的建議或推薦。請閱讀使用條款以了解更多資訊。
免責聲明
這些資訊和出版物並非旨在提供,也不構成TradingView提供或認可的任何形式的財務、投資、交易或其他類型的建議或推薦。請閱讀使用條款以了解更多資訊。