
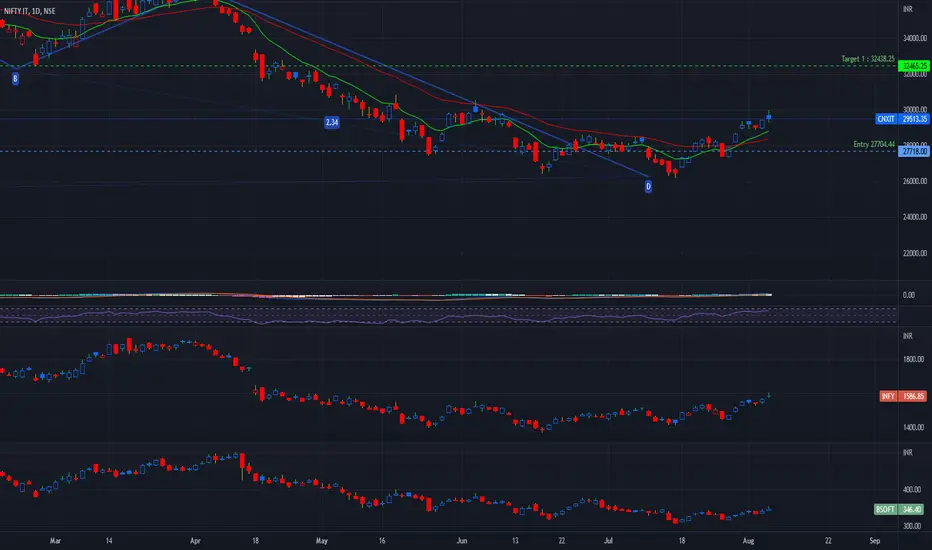
Bat Pattern:
It starts with a bullish XA move. AB is then bearish . BC is bullish , and CD is bearish again.
XA: This can be any price activity on the chart. There is no specific price movement in Bat chart formation.
AB: The AB move should be between 38.2 to 50 % Fibonacci of XA.
BC: The BC move should finish between 38.2% and 88.6% Fibonacci of AB.
CD: Ideally point D should represent 127% to 161.8% Fibonacci extension of BC Leg. Look for entry at point D once you see the trend reversal.
Profit Target: As mentioned in the chart.
Stop Loss : should be just below X with a support channel.
As you can see from the above chart the NIFTY IT ( CNXIT ) has completed the bat pattern and is moving up optimistically We should see the price touch target 1. Since it's on a corrective wave on Elliot's principle Target 1 is most likely to be completed. MACD has crossed the signal line on a weekly timeframe .
INFY ( Infosys ) & BSOFT (BirlaSoft) are on the same trend line as the IT index.
Disclaimer: “The above is an idea only and not any kind of any financial advice so please do your own DD (Due Diligence) before any kind of investment”.
If you like my TA & ideas!! Want to keep yourself updated with current market action, then please follow my profile for more analysis.
It starts with a bullish XA move. AB is then bearish . BC is bullish , and CD is bearish again.
XA: This can be any price activity on the chart. There is no specific price movement in Bat chart formation.
AB: The AB move should be between 38.2 to 50 % Fibonacci of XA.
BC: The BC move should finish between 38.2% and 88.6% Fibonacci of AB.
CD: Ideally point D should represent 127% to 161.8% Fibonacci extension of BC Leg. Look for entry at point D once you see the trend reversal.
Profit Target: As mentioned in the chart.
Stop Loss : should be just below X with a support channel.
As you can see from the above chart the NIFTY IT ( CNXIT ) has completed the bat pattern and is moving up optimistically We should see the price touch target 1. Since it's on a corrective wave on Elliot's principle Target 1 is most likely to be completed. MACD has crossed the signal line on a weekly timeframe .
INFY ( Infosys ) & BSOFT (BirlaSoft) are on the same trend line as the IT index.
Disclaimer: “The above is an idea only and not any kind of any financial advice so please do your own DD (Due Diligence) before any kind of investment”.
If you like my TA & ideas!! Want to keep yourself updated with current market action, then please follow my profile for more analysis.

免責聲明
這些資訊和出版物並非旨在提供,也不構成TradingView提供或認可的任何形式的財務、投資、交易或其他類型的建議或推薦。請閱讀使用條款以了解更多資訊。