
Concor India - Potential Double Bottom Breakout underway
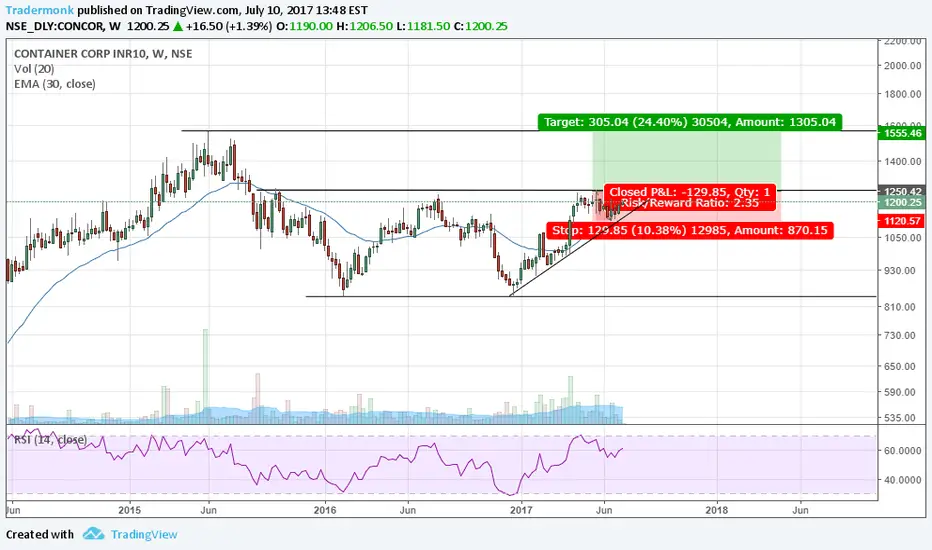
Potential Double bottom pattern (Adam & Adam formation) awaiting upward breakout observed in Concor India Ltd weekly chart.
Resistance zone is at 1200-1250 levels. A close above 1250 with higher volumes would indicate confirmation of the Double Bottom pattern formation which is a bullish sign for the stock.
Swing Trading Strategy :
Buy : Above 1250 level (on closing basis)
Target : 1550 (Old Resistance level as on 1st June 2015)
Stop Loss : Below 1120
Trade Safe !!!
Note : I have no current positions in this stock but may enter a position or multiple positions in the coming days and weeks.
Resistance zone is at 1200-1250 levels. A close above 1250 with higher volumes would indicate confirmation of the Double Bottom pattern formation which is a bullish sign for the stock.
Swing Trading Strategy :
Buy : Above 1250 level (on closing basis)
Target : 1550 (Old Resistance level as on 1st June 2015)
Stop Loss : Below 1120
Trade Safe !!!
Note : I have no current positions in this stock but may enter a position or multiple positions in the coming days and weeks.
交易進行
Closed above 1250
免責聲明
這些資訊和出版物並非旨在提供,也不構成TradingView提供或認可的任何形式的財務、投資、交易或其他類型的建議或推薦。請閱讀使用條款以了解更多資訊。
免責聲明
這些資訊和出版物並非旨在提供,也不構成TradingView提供或認可的任何形式的財務、投資、交易或其他類型的建議或推薦。請閱讀使用條款以了解更多資訊。