
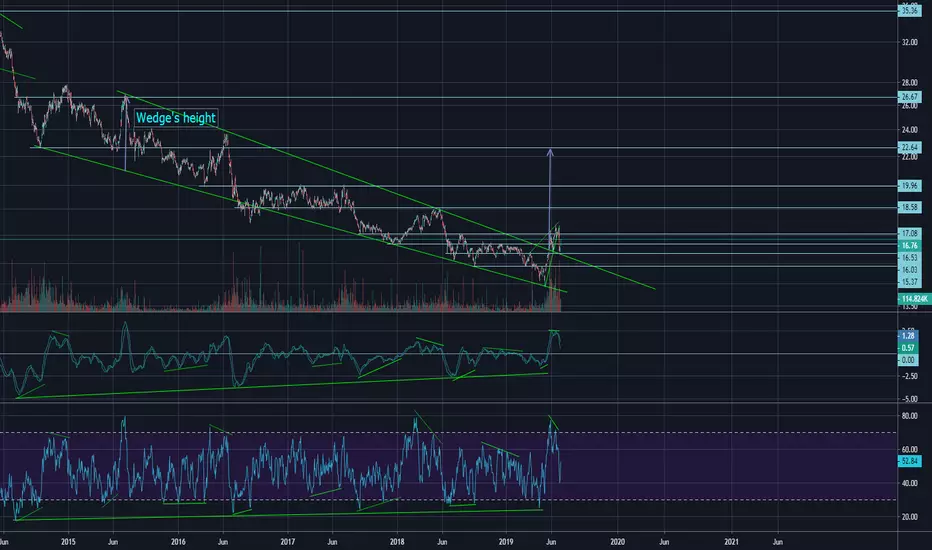
CORN has broken out of a bullish descending wedge pattern to the upside, entered a bearish rising wedge, broken down and back-tested the previous resistance level before bouncing back. There are positive divergences on the charts which suggest a much longer up trend in play. These positive divergences can also be seen on the weekly and monthly charts of CORN which also firm up the thesis of a new long term uptrend. When measuring the height of the wedge pattern and adding it to the breakout point, the anticipated price coincides with a former support/resistance level.

免責聲明
這些資訊和出版物並非旨在提供,也不構成TradingView提供或認可的任何形式的財務、投資、交易或其他類型的建議或推薦。請閱讀使用條款以了解更多資訊。
免責聲明
這些資訊和出版物並非旨在提供,也不構成TradingView提供或認可的任何形式的財務、投資、交易或其他類型的建議或推薦。請閱讀使用條款以了解更多資訊。