
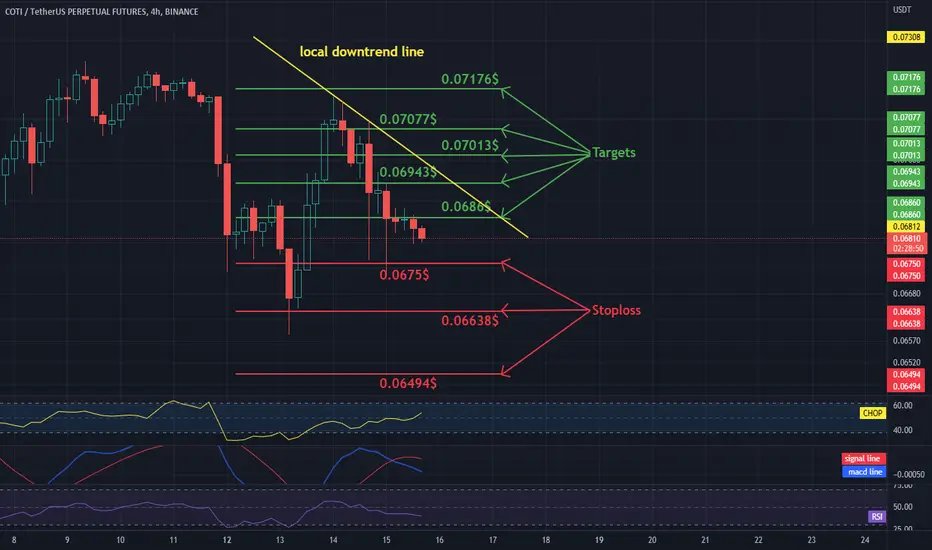
Hello everyone, let's look at the 4H COTI to USDT chart as you can see that the price is moving below the local downtrend line.
Let's start by setting goals for the near future that we can take into account:
T1 = $0.0686
T2 = $0.06943
T3 = $0.07013
T4 = $0.07077
and
T5 = $0.07176
Now let's move on to the stop loss in case the market goes down further:
SL1 = $0.0675
SL2 = $0.06638
and
SL3 = $0.06494
Looking at the CHOP indicator, we see that the energy is gathering more and more strength on the 4H interval, while the MACD indicator indicates a local downtrend. It is also worth adding that we have a rebound on the RSI.
Let's start by setting goals for the near future that we can take into account:
T1 = $0.0686
T2 = $0.06943
T3 = $0.07013
T4 = $0.07077
and
T5 = $0.07176
Now let's move on to the stop loss in case the market goes down further:
SL1 = $0.0675
SL2 = $0.06638
and
SL3 = $0.06494
Looking at the CHOP indicator, we see that the energy is gathering more and more strength on the 4H interval, while the MACD indicator indicates a local downtrend. It is also worth adding that we have a rebound on the RSI.

免責聲明
這些資訊和出版物並非旨在提供,也不構成TradingView提供或認可的任何形式的財務、投資、交易或其他類型的建議或推薦。請閱讀使用條款以了解更多資訊。
免責聲明
這些資訊和出版物並非旨在提供,也不構成TradingView提供或認可的任何形式的財務、投資、交易或其他類型的建議或推薦。請閱讀使用條款以了解更多資訊。