
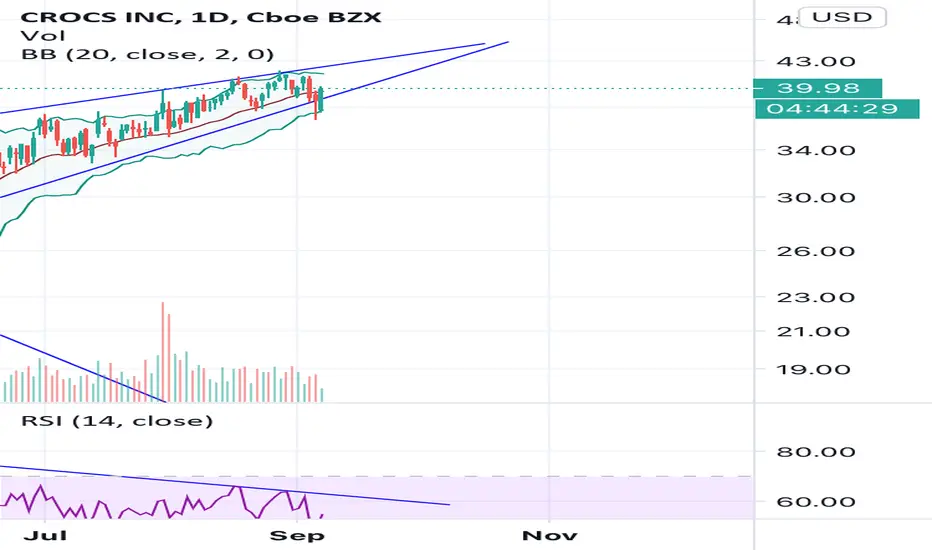
In spite of market weakness, ticker CROX is still holding its support line after briefly dipping below. This indicates high buying pressure. Expect CROX follow the uptrend until it hits the resistance line. Look for contracted volatility to predict when a breakout might happen. I would set a stop buy order or Open a call at a point above 42.50 (43 just to be safe. The RSI and Bollinger bands indicate much of the same: confined price swings while it is stuck in a wedge. In my opinion, there is a 2-month flag pattern being formed. A flag pattern is a Breakout followed by a wedge/ triangle pattern, followed by another breakout in the same direction. Accordingly, I am bullish on this stock in the near term.

免責聲明
這些資訊和出版物並非旨在提供,也不構成TradingView提供或認可的任何形式的財務、投資、交易或其他類型的建議或推薦。請閱讀使用條款以了解更多資訊。