#CTSI/BTC (May 31)
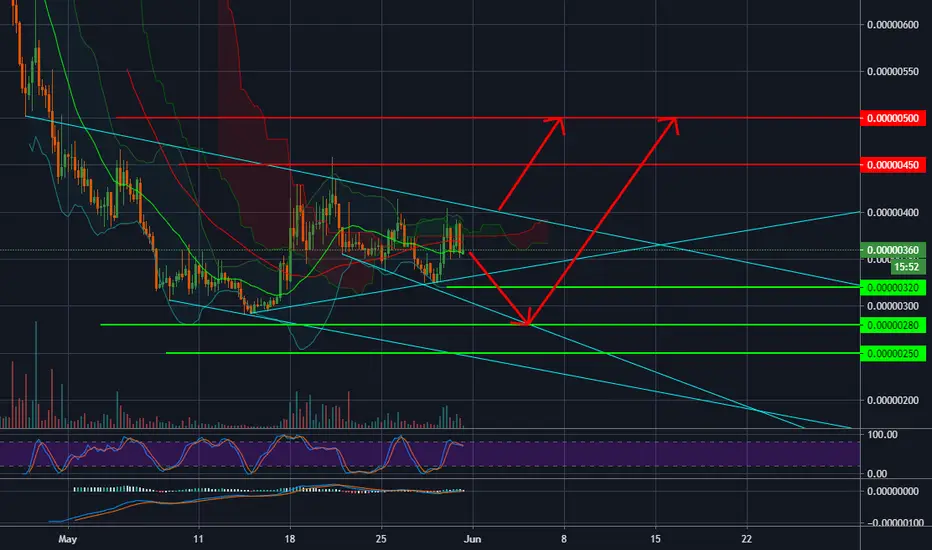
At this moment, what we can see on CTSI chart is that the selling force is dominant and the purpose of pushing the price up is to sell large quantities of CTSI.
In addition, CTSI is in a very bad pattern, Symmetrical Triangle in downtrend, so the price direction is moving down.
We will buy CTSI in 2 cases :
- Break out and stand stable above 400sts
- Catch gradually at these points : 320 - 280 and 250sts
The nearest sell target is 450 and 500
In addition, CTSI is in a very bad pattern, Symmetrical Triangle in downtrend, so the price direction is moving down.
We will buy CTSI in 2 cases :
- Break out and stand stable above 400sts
- Catch gradually at these points : 320 - 280 and 250sts
The nearest sell target is 450 and 500

免責聲明
這些資訊和出版物並非旨在提供,也不構成TradingView提供或認可的任何形式的財務、投資、交易或其他類型的建議或推薦。請閱讀使用條款以了解更多資訊。
免責聲明
這些資訊和出版物並非旨在提供,也不構成TradingView提供或認可的任何形式的財務、投資、交易或其他類型的建議或推薦。請閱讀使用條款以了解更多資訊。