做多
Cartesi Breaks Falling Wedge (Short-Term Move)
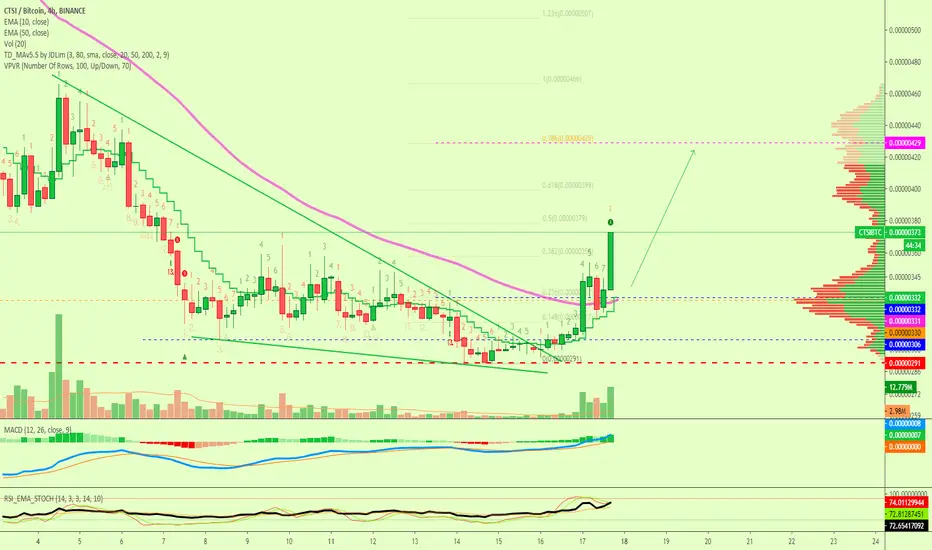
CTSIBTC just broke above resistance and is starting to gain momentum.
I've marked the next short-term target on this chart.
Cartesi (CTSIBTC) Chart Signals
Prices can go straight up as shown by the green arrow.
Conditions for change
On a drop, support can be found around 0.00000333.
Thanks a lot for reading.
Namaste.
I've marked the next short-term target on this chart.
Cartesi (CTSIBTC) Chart Signals
- Here we can notice the volume bars going green and becoming bigger, there can easily be more growth.
- EMA10 is moving above EMA50.
- We also have a strong RSI.
Prices can go straight up as shown by the green arrow.
Conditions for change
On a drop, support can be found around 0.00000333.
Thanks a lot for reading.
Namaste.
交易結束:目標達成
Perfect hit.
✅ Cryptocurrencies technical analysis & results
t.me/masteranandatrades/9279
✅ Stocks technical analysis
t.me/anandastocks
✅ Enjoyed the content? Join my PREMIUM channels for more... t.me/lamatrades/4 (since 2017)
t.me/masteranandatrades/9279
✅ Stocks technical analysis
t.me/anandastocks
✅ Enjoyed the content? Join my PREMIUM channels for more... t.me/lamatrades/4 (since 2017)
相關出版品
免責聲明
這些資訊和出版物並非旨在提供,也不構成TradingView提供或認可的任何形式的財務、投資、交易或其他類型的建議或推薦。請閱讀使用條款以了解更多資訊。
✅ Cryptocurrencies technical analysis & results
t.me/masteranandatrades/9279
✅ Stocks technical analysis
t.me/anandastocks
✅ Enjoyed the content? Join my PREMIUM channels for more... t.me/lamatrades/4 (since 2017)
t.me/masteranandatrades/9279
✅ Stocks technical analysis
t.me/anandastocks
✅ Enjoyed the content? Join my PREMIUM channels for more... t.me/lamatrades/4 (since 2017)
相關出版品
免責聲明
這些資訊和出版物並非旨在提供,也不構成TradingView提供或認可的任何形式的財務、投資、交易或其他類型的建議或推薦。請閱讀使用條款以了解更多資訊。