Weekly Chart :

 CVM Finished the Major Down Trend on April 2019, and from then is in a solid Secondary Up Trend.
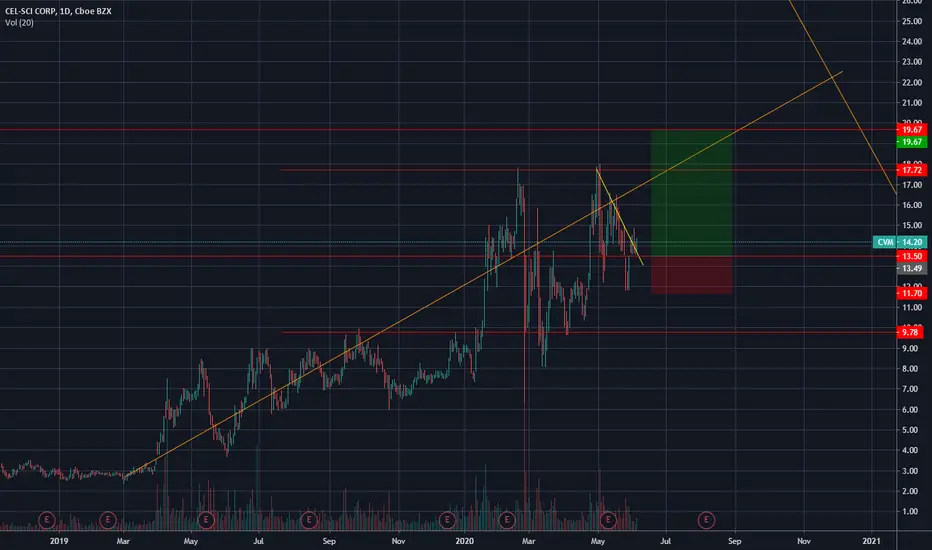
Note 13.50 Historical level, which serve us as a good support to form a trade.
Daily Chart :

Minor Down Trend about to end (Yellow):

Line Chart :

The Trade Plan :

Wait for a Clear Bullish Minor sign -
1. Strong buying Candle on 13.50 Level .
2. Retest of the Orange Trendline and closing above the Yellow Trendline.
CVM Finished the Major Down Trend on April 2019, and from then is in a solid Secondary Up Trend.Note 13.50 Historical level, which serve us as a good support to form a trade.
Daily Chart :
Minor Down Trend about to end (Yellow):
Line Chart :
The Trade Plan :
Wait for a Clear Bullish Minor sign -
1. Strong buying Candle on 13.50 Level .
2. Retest of the Orange Trendline and closing above the Yellow Trendline.

免責聲明
這些資訊和出版物並非旨在提供,也不構成TradingView提供或認可的任何形式的財務、投資、交易或其他類型的建議或推薦。請閱讀使用條款以了解更多資訊。
免責聲明
這些資訊和出版物並非旨在提供,也不構成TradingView提供或認可的任何形式的財務、投資、交易或其他類型的建議或推薦。請閱讀使用條款以了解更多資訊。