
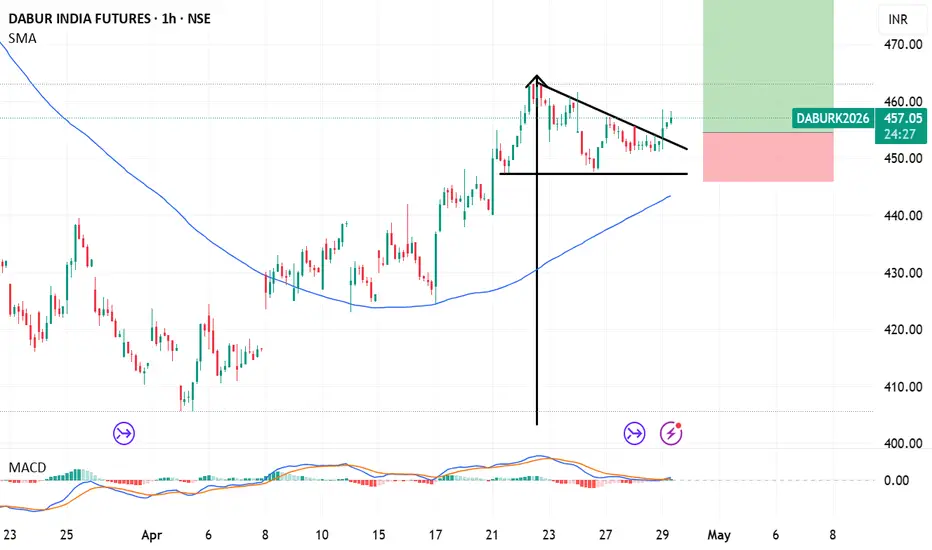
Dabur India Futures (DABUR) has been showing signs of consolidation and potential base-building, with analysts noting technical signals that could indicate a reversal, including a potential flag pattern on lower timeframes.
The stock has been attempting to form a base in the ₹440–₹465 range.
Action: Potential Long/Buy
Target (T1): ₹485 (Based on pattern breakout projection)
Stop Loss (SL): ₹445 (Below immediate support levels)
Key Support to Watch: ₹446–₹449
Key Resistance to Break: ₹461–₹463
The stock has been attempting to form a base in the ₹440–₹465 range.
Action: Potential Long/Buy
Target (T1): ₹485 (Based on pattern breakout projection)
Stop Loss (SL): ₹445 (Below immediate support levels)
Key Support to Watch: ₹446–₹449
Key Resistance to Break: ₹461–₹463
交易結束:達到停損點

免責聲明
這些資訊和出版物並非旨在提供,也不構成TradingView提供或認可的任何形式的財務、投資、交易或其他類型的建議或推薦。請閱讀使用條款以了解更多資訊。
免責聲明
這些資訊和出版物並非旨在提供,也不構成TradingView提供或認可的任何形式的財務、投資、交易或其他類型的建議或推薦。請閱讀使用條款以了解更多資訊。