
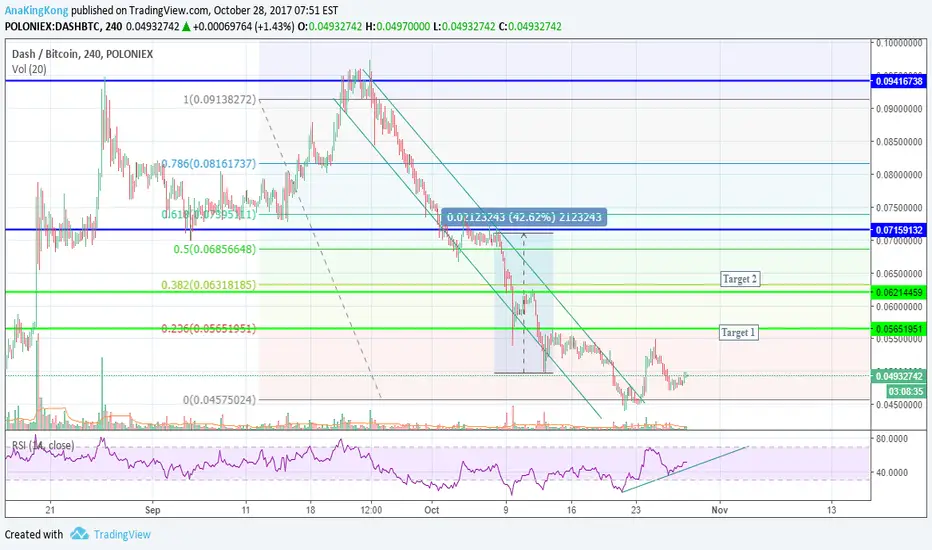
DASHBTC passed very hard time last month its dropped from its high @0.096 on 22 September to the bottom @ 0.044 21 October
(by 42 degrees) trendline, this decline came as a reaction of double top pattern which formed on 26 August
Now targets of the pattern is complete and the rising era finally came - we should watch carefully RSI indicator when reaching overbought zone -
Targets as always are marked by green lines
Thank you
------------------------------------------------------------
Don't read and leave .. Like, Comment and Follow ...... its so easy
(by 42 degrees) trendline, this decline came as a reaction of double top pattern which formed on 26 August
Now targets of the pattern is complete and the rising era finally came - we should watch carefully RSI indicator when reaching overbought zone -
Targets as always are marked by green lines
Thank you
------------------------------------------------------------
Don't read and leave .. Like, Comment and Follow ...... its so easy

免責聲明
這些資訊和出版物並非旨在提供,也不構成TradingView提供或認可的任何形式的財務、投資、交易或其他類型的建議或推薦。請閱讀使用條款以了解更多資訊。
免責聲明
這些資訊和出版物並非旨在提供,也不構成TradingView提供或認可的任何形式的財務、投資、交易或其他類型的建議或推薦。請閱讀使用條款以了解更多資訊。