
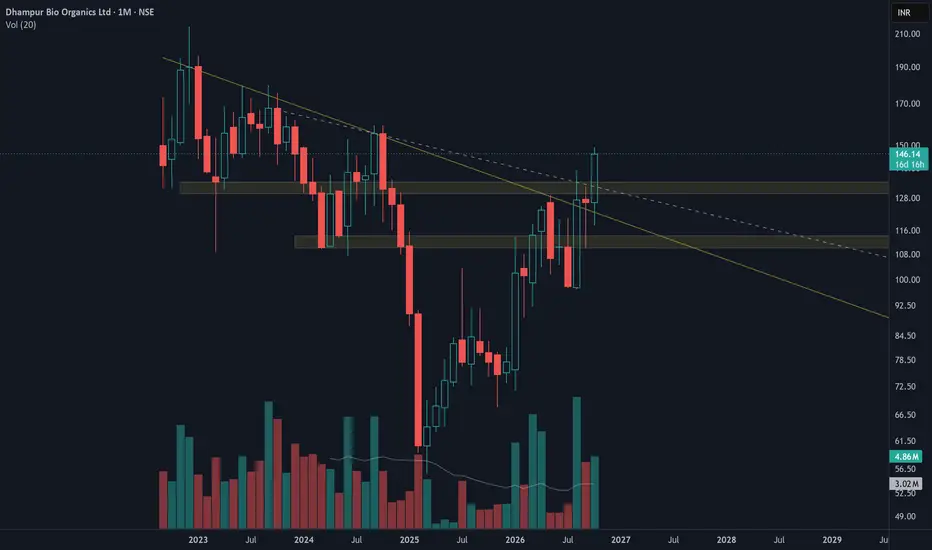
Pattern Structure: The chart showcases a well-defined descending pattern, a structural formation where the white dashed line acts as a crucial hidden resistance level before the current price action.
Volume Analysis: A significant surge in buying volume propels the breakout, serving as a vital confirmation and protecting traders from potential false breakouts.
Supply and Demand Flip Zone: Observe the transition zone: an initial demand area that turned into resistance, and has now been reclaimed, indicating a shift back to demand.
Importance of Risk Management: Preserving capital is key, which makes strict stop-losses a necessary component when navigating volatile market environments.
Probable Targets: Upward momentum is likely to target previous structural highs and liquidity zones located at the upper boundaries of the chart.
Disclaimer:
The information shared is solely for educational purposes and not financial advice. Trading involves risk, so assess your situation before taking action.
Volume Analysis: A significant surge in buying volume propels the breakout, serving as a vital confirmation and protecting traders from potential false breakouts.
Supply and Demand Flip Zone: Observe the transition zone: an initial demand area that turned into resistance, and has now been reclaimed, indicating a shift back to demand.
Importance of Risk Management: Preserving capital is key, which makes strict stop-losses a necessary component when navigating volatile market environments.
Probable Targets: Upward momentum is likely to target previous structural highs and liquidity zones located at the upper boundaries of the chart.
Disclaimer:
The information shared is solely for educational purposes and not financial advice. Trading involves risk, so assess your situation before taking action.

免責聲明
這些資訊和出版物並非旨在提供,也不構成TradingView提供或認可的任何形式的財務、投資、交易或其他類型的建議或推薦。請閱讀使用條款以了解更多資訊。