
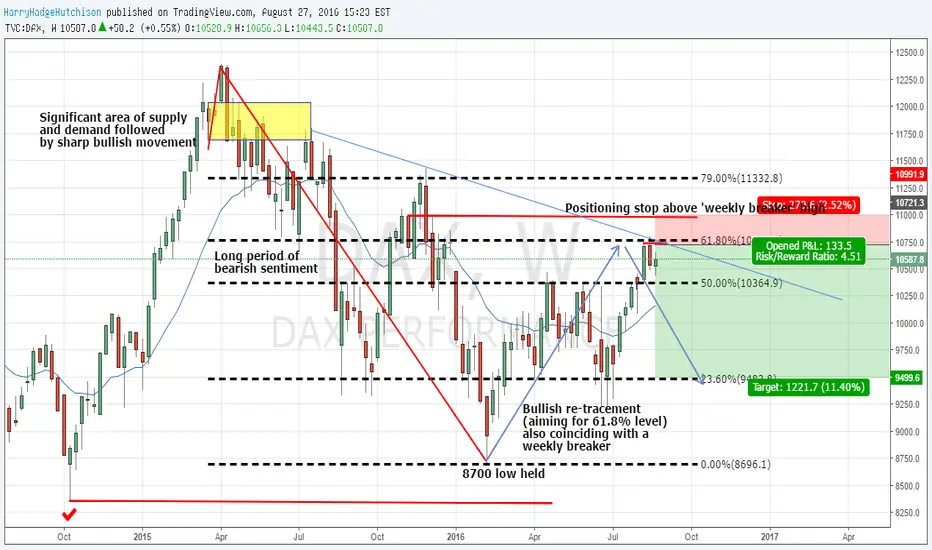
Step by step analysis provided in the chart. Following the high made in April 2015 to the low made in February 2016 there appeared to be an area of low volume, which now has successfully been filled up to the 61.8% retracement level. Back testing this idex shows its sensitivity towards this '61.8' level. To make things more convincing, this level is also lining up with a weekly breaker. To minimize risk and maximize R:R, stops will be placed above last weeks high at 10803. Should the up-coming week not break the high, this will also form a PO3 giving the short even more confluence.

免責聲明
這些資訊和出版物並非旨在提供,也不構成TradingView提供或認可的任何形式的財務、投資、交易或其他類型的建議或推薦。請閱讀使用條款以了解更多資訊。
免責聲明
這些資訊和出版物並非旨在提供,也不構成TradingView提供或認可的任何形式的財務、投資、交易或其他類型的建議或推薦。請閱讀使用條款以了解更多資訊。