已更新
Inverse H&S Formation?
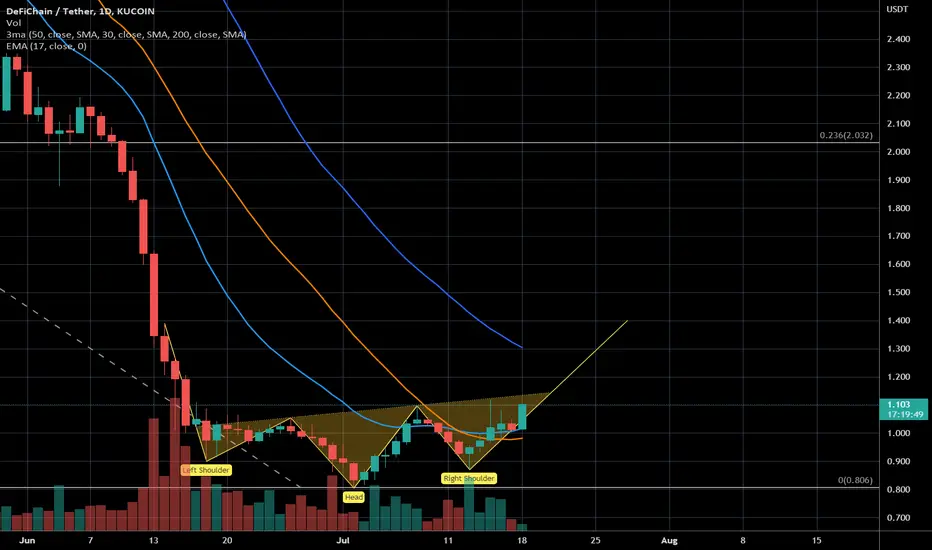
You can see an inverse H&S chart pattern is forming in DFI/USDT. We have broken the EMA 17 and SMA 30 already to the upside - the SMA 50 could offer a bit more resistance at currently 1.30 USD.
For me it seems like the crypto market could reverse (see also the BTC/USD chart) - not to approach the ATHs but to make a first move to the upside. We'll see.
For me it seems like the crypto market could reverse (see also the BTC/USD chart) - not to approach the ATHs but to make a first move to the upside. We'll see.
註釋
It was going a bit longer sideways then I've expected - you may extend the right line further to the right. However - it seems that the formation has successfully broken to the upside.
免責聲明
這些資訊和出版物並非旨在提供,也不構成TradingView提供或認可的任何形式的財務、投資、交易或其他類型的建議或推薦。請閱讀使用條款以了解更多資訊。