
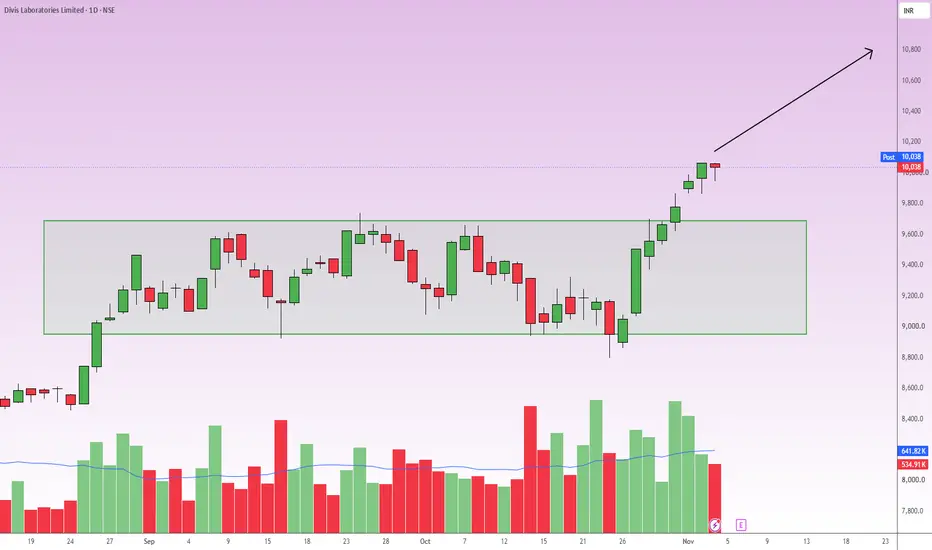
Looking at the daily chart for Divi's Laboratories Limited, the price action has recently emerged from a distinct consolidation phase.
For several weeks, the stock was trading within a tight rectangular zone (highlighted by the green box) with support near 9,000 and resistance near 9,650.
We have now witnessed a decisive breakout above this upper resistance boundary.
More importantly, this breakout is validated by a significant surge in buying volume (indicated by the tall green volume bars at the bottom of the chart).
This volume expansion confirms the institutional interest and suggests strong, sustained bullish momentum as the stock currently sits around 10,038.
Trade Setup:
Entry Point: Current Market Price around 10,038, or ideally on a minor pullback to retest the breakout level near the 9,700 - 9,800 zone.
Target: Based on the upward projection (indicated by the black arrow), the primary bullish target is anticipated around the 10,800 level.
Stop Loss: A strict stop loss should be placed around 9,500 - 9,550.
This sits safely inside the upper portion of the previous consolidation box.
If the price falls back and closes below this level, it would suggest a false breakout and invalidate the bullish thesis.
For several weeks, the stock was trading within a tight rectangular zone (highlighted by the green box) with support near 9,000 and resistance near 9,650.
We have now witnessed a decisive breakout above this upper resistance boundary.
More importantly, this breakout is validated by a significant surge in buying volume (indicated by the tall green volume bars at the bottom of the chart).
This volume expansion confirms the institutional interest and suggests strong, sustained bullish momentum as the stock currently sits around 10,038.
Trade Setup:
Entry Point: Current Market Price around 10,038, or ideally on a minor pullback to retest the breakout level near the 9,700 - 9,800 zone.
Target: Based on the upward projection (indicated by the black arrow), the primary bullish target is anticipated around the 10,800 level.
Stop Loss: A strict stop loss should be placed around 9,500 - 9,550.
This sits safely inside the upper portion of the previous consolidation box.
If the price falls back and closes below this level, it would suggest a false breakout and invalidate the bullish thesis.

免責聲明
這些資訊和出版物並非旨在提供,也不構成TradingView提供或認可的任何形式的財務、投資、交易或其他類型的建議或推薦。請閱讀使用條款以了解更多資訊。
免責聲明
這些資訊和出版物並非旨在提供,也不構成TradingView提供或認可的任何形式的財務、投資、交易或其他類型的建議或推薦。請閱讀使用條款以了解更多資訊。