
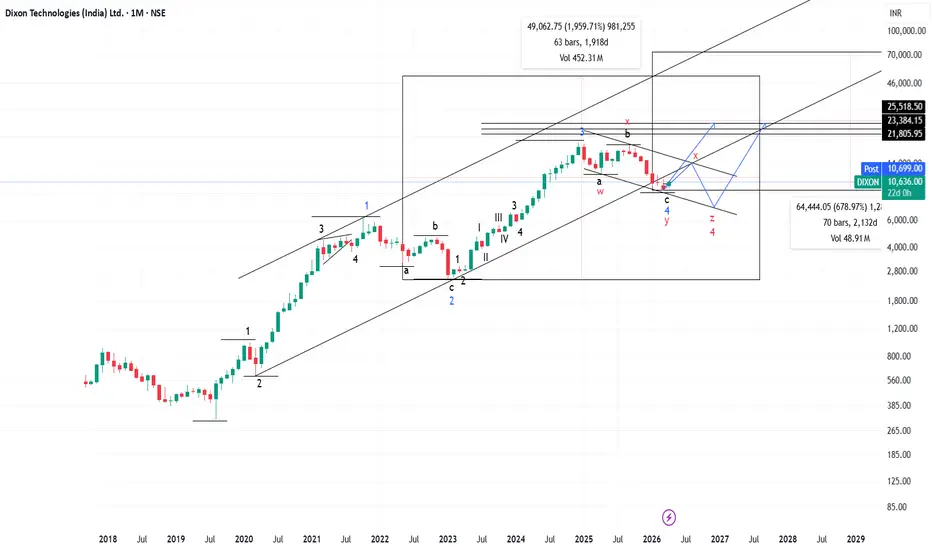
Dixon Technologies is currently trading within a complex corrective-to-impulsive transition zone, with both primary and alternate wave counts in play. The primary structure (marked in blue/black) suggests continuation potential, while alternate counts (marked in red) indicate the possibility of extended consolidation.
Primary Bullish Scenario (Higher Probability)
Under the primary wave count, price appears positioned for a direct impulsive advance, potentially extending toward:
This scenario assumes continuation without a deep intermediate correction, supported by structural alignment within the broader trend.
Alternate Bullish Scenario (Complex Correction Before Expansion)
An alternate pathway suggests that price may:
Structural Interpretation
The coexistence of multiple valid counts highlights that the stock is at a decision-making juncture, where confirmation will depend on how price behaves near resistance zones.
In summary, while the long-term bias remains constructive, the path forward may either be:
Traders and investors should monitor price behaviour near key channel levels to validate the active scenario.
Primary Bullish Scenario (Higher Probability)
Under the primary wave count, price appears positioned for a direct impulsive advance, potentially extending toward:
- ₹13,500 – near-term resistance aligned with channel boundaries
- ₹25,500 – broader target derived from 161.8% Fibonacci extension
This scenario assumes continuation without a deep intermediate correction, supported by structural alignment within the broader trend.
Alternate Bullish Scenario (Complex Correction Before Expansion)
An alternate pathway suggests that price may:
- Advance toward the channel resistance (~₹13,500),
- Face rejection and retrace toward the lower boundary of the channel (~₹7,300),
- Subsequently resume the uptrend in a complex corrective structure (W–X–Y–X–Z formation) before entering the next impulsive phase.
Structural Interpretation
The coexistence of multiple valid counts highlights that the stock is at a decision-making juncture, where confirmation will depend on how price behaves near resistance zones.
In summary, while the long-term bias remains constructive, the path forward may either be:
- Direct impulsive expansion, or
- Extended consolidation before breakout
Traders and investors should monitor price behaviour near key channel levels to validate the active scenario.

免責聲明
這些資訊和出版物並非旨在提供,也不構成TradingView提供或認可的任何形式的財務、投資、交易或其他類型的建議或推薦。請閱讀使用條款以了解更多資訊。
免責聲明
這些資訊和出版物並非旨在提供,也不構成TradingView提供或認可的任何形式的財務、投資、交易或其他類型的建議或推薦。請閱讀使用條款以了解更多資訊。