
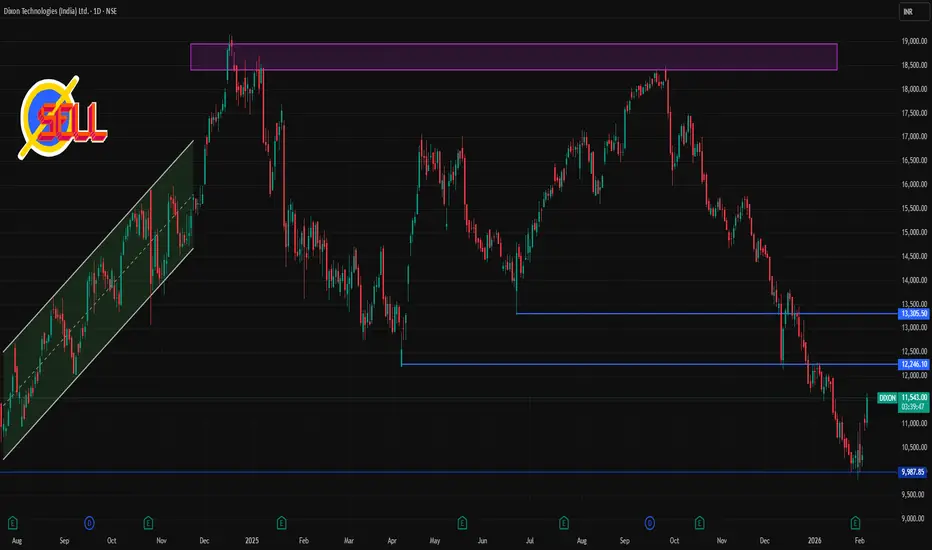
📍 Live Price Snapshot
🔹 Approx Current Price: ~₹11,566 (INR) (up strong recently)
🔹 52-Week Range: ~₹9,835 – ₹18,471
📊 Daily Pivot & Support/Resistance Levels (1D Timeframe)
These are commonly used by traders to judge intraday/daily trend bias, entry/exit zones, and key price reactions:
Level Price (Approx) Type
R3 ₹11,551 – ₹11,600 Major Resistance
R2 ₹11,375 – ₹11,380 Resistance Zone
R1 ₹11,203 Near-Term Resistance
Pivot ~₹11,027 Daily Center / Bias Level
S1 ₹10,855 Support
S2 ₹10,679 Support Zone
S3 ₹10,507 Strong Support
👉 Price above Pivot & R1–R3: Bullish bias
👉 Price below Pivot & heading toward S1–S3: Bearish/neutral pressure
These are classic pivot levels updated for today’s trading range.
📈 Short-Term Technical Structure
Bullish / Positive signs:
Price recently moved above short EMAs (e.g., 5-, 9-day), showing short-term strength.
RSI around mid-range suggests room to run upside without overbought stress.
Bearish / Caution flags:
Longer moving averages (50/100/200) still overhead as resistance — trending bias remains cautious.
Technicals from some chart views still show a weak structure on daily if price fails below pivot.
📌 How to Use These Levels Today
✔ Bullish bias only if price sustains above pivot (~₹11,027)
✔ Near-term breakout zone: Clear move above R2 (~₹11,375) / R3 (~₹11,550)
✔ Support watches: Monitor S1 (~₹10,855) and S2 (~₹10,680) for pullbacks
✔ Break below S3 (~₹10,507) — could signal deeper intraday bearish pressure
🧠 Quick Context
Shares recently rebounded and are above short-term EMAs, indicating some short-term strength.
Overall broader market influences (mid-cap pressure / sector flow) still matter for this stock’s direction.
Price near multimonth lows, so risk and volatility remain elevated.

Contact Knowledgehub for a detailed consultation: Dm on WhatsApp: [wa.link/a2o0kz]-
Phone No: [+91 93102 26243]-
Email: [tradingviewknowledgehub@gmail.com]---
-- Let’s achieve success together!
Phone No: [+91 93102 26243]-
Email: [tradingviewknowledgehub@gmail.com]---
-- Let’s achieve success together!
相關出版品
免責聲明
這些資訊和出版物並非旨在提供,也不構成TradingView提供或認可的任何形式的財務、投資、交易或其他類型的建議或推薦。請閱讀使用條款以了解更多資訊。