
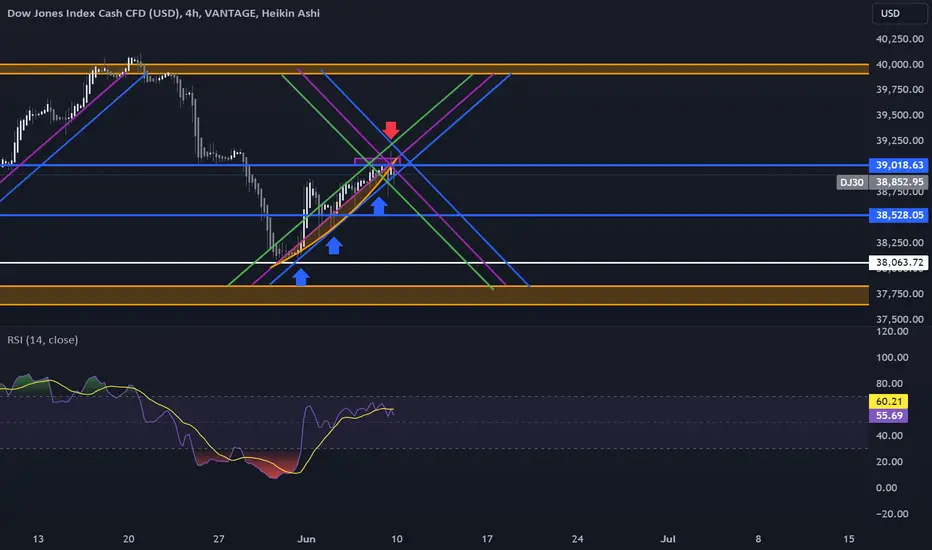
When you look at the daily range on DJ30 you can see that those zones ( horizontal blue) do not offer clean entries, because they are being honored.
But we get a clear direction and momentum and even though there is no clear RSI value, instead we have much volatility and a diagonal trendline being supported various times. The less distant it bounces from the trendline, the weaker it gets.
Pay attention to the new trendline that has been created. It might not be very accurate yet, because we have little data. But this is how it could possibly look like if this continues to drop...
But we get a clear direction and momentum and even though there is no clear RSI value, instead we have much volatility and a diagonal trendline being supported various times. The less distant it bounces from the trendline, the weaker it gets.
Pay attention to the new trendline that has been created. It might not be very accurate yet, because we have little data. But this is how it could possibly look like if this continues to drop...

免責聲明
這些資訊和出版物並非旨在提供,也不構成TradingView提供或認可的任何形式的財務、投資、交易或其他類型的建議或推薦。請閱讀使用條款以了解更多資訊。