
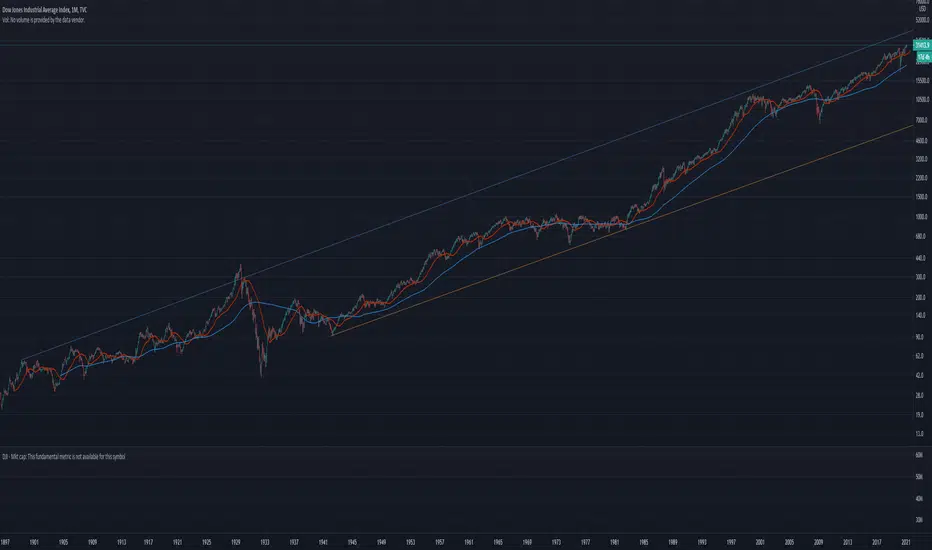
I keep hearing that stocks are in a bubble, but that just isn't true. People always look at charts in a linear mode, but this is not how math works. To get accurate prices and movement we MUST look at a logarithmic chart. When you do this for the Dow Jones average for the last century you clearly see we perhaps are a little inflated, but nowhere near Bubble territory. You want a Bubble? 1929 - now *that* was wildly over valued (with a subsequent epic crash). Now if in 2023 the Dow is above 45k? Then you can get back to me about how we might be in an asset Bubble. Until then I expect the trend to continue bullish.

免責聲明
這些資訊和出版物並非旨在提供,也不構成TradingView提供或認可的任何形式的財務、投資、交易或其他類型的建議或推薦。請閱讀使用條款以了解更多資訊。
免責聲明
這些資訊和出版物並非旨在提供,也不構成TradingView提供或認可的任何形式的財務、投資、交易或其他類型的建議或推薦。請閱讀使用條款以了解更多資訊。