
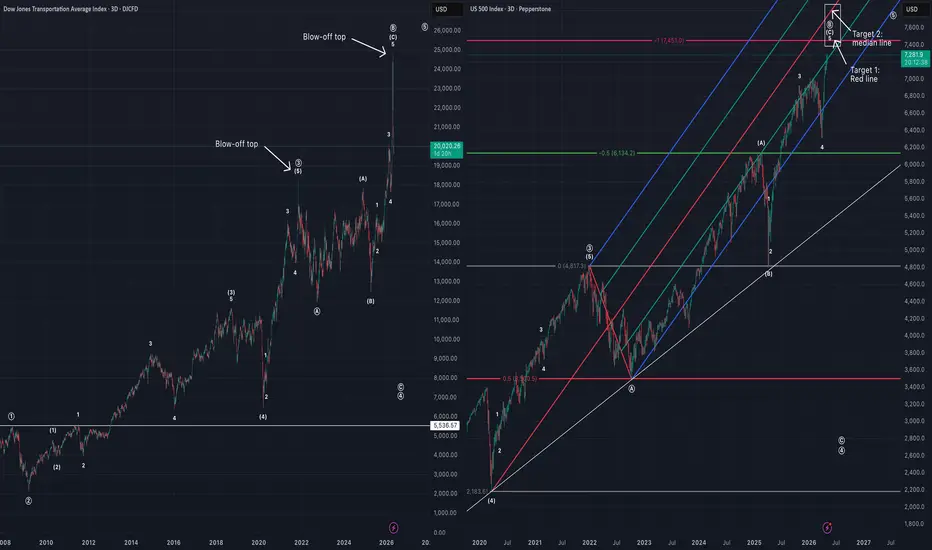
Chart comparing DJT and US500.
This comparison assumes both are in similar positions regarding their supercycle structures.
DJT has already completed its ((B)) wave with a blow-off top, as DJT tends to be a leading rather than lagging indicator for the larger equity markets.
US500 has been very technical since COVID low. I'm looking for it to top around 7451 or perhaps it goes a little bit extra to the median line target.
This comparison assumes both are in similar positions regarding their supercycle structures.
DJT has already completed its ((B)) wave with a blow-off top, as DJT tends to be a leading rather than lagging indicator for the larger equity markets.
US500 has been very technical since COVID low. I'm looking for it to top around 7451 or perhaps it goes a little bit extra to the median line target.

免責聲明
這些資訊和出版物並非旨在提供,也不構成TradingView提供或認可的任何形式的財務、投資、交易或其他類型的建議或推薦。請閱讀使用條款以了解更多資訊。
免責聲明
這些資訊和出版物並非旨在提供,也不構成TradingView提供或認可的任何形式的財務、投資、交易或其他類型的建議或推薦。請閱讀使用條款以了解更多資訊。