
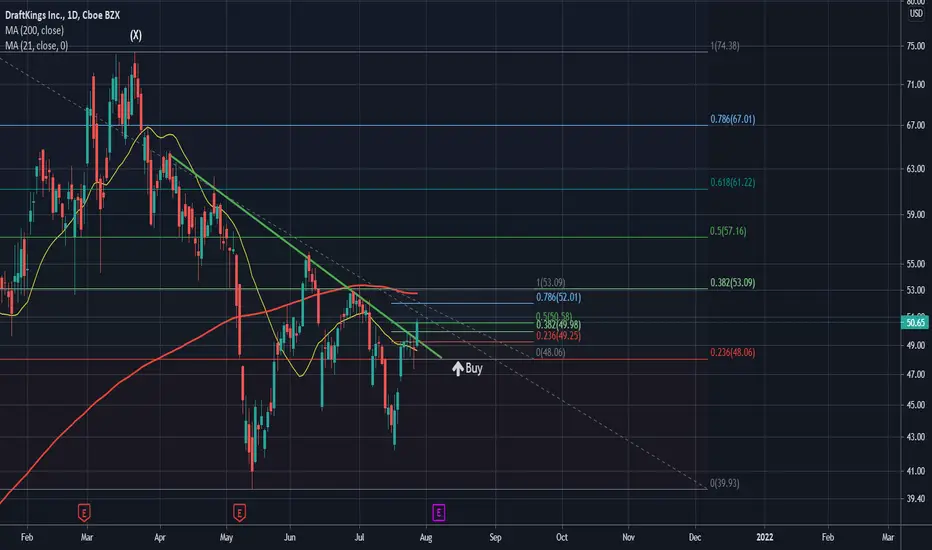
DKNG crossed the creek of a persistent downward sloping supply line today after breaking above the .236 fibonacci level of the retracement shown on the chart.
Anything above $48 is bullish and now that you have a decisive looking candle breaking out of the trendline on the daily, that only adds as further validation.
The price is in the middle of our .236 to .382 fibonacci range, but there are local support levels that could be used as entry areas. For instance today we closed above $50.58, an area that corresponds with a 50% retracement of this range. Support above a 50% retracement is often bullish and could make for an entry for a long but keep in mind your lowest risk area will always be at the macro lower support which in this case would be at $48.06 (.236 fib level).
Anything above $48 is bullish and now that you have a decisive looking candle breaking out of the trendline on the daily, that only adds as further validation.
The price is in the middle of our .236 to .382 fibonacci range, but there are local support levels that could be used as entry areas. For instance today we closed above $50.58, an area that corresponds with a 50% retracement of this range. Support above a 50% retracement is often bullish and could make for an entry for a long but keep in mind your lowest risk area will always be at the macro lower support which in this case would be at $48.06 (.236 fib level).

免責聲明
這些資訊和出版物並非旨在提供,也不構成TradingView提供或認可的任何形式的財務、投資、交易或其他類型的建議或推薦。請閱讀使用條款以了解更多資訊。