
I saw a really interesting chart from MartyBanks about DoDo, I've linked it in the related ideas.
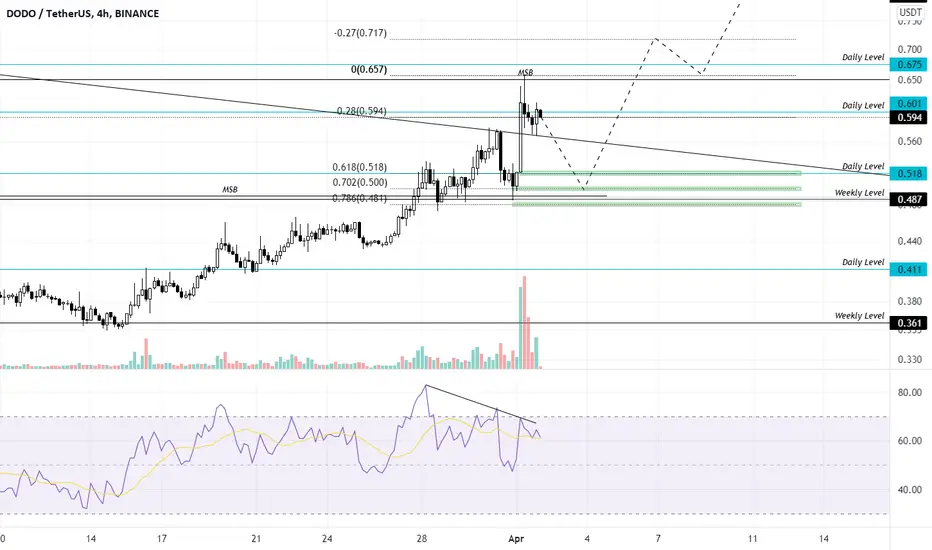
So I decided to look back and chart DoDo. After a massive dump it found support on the weekly level and more recently bouncing from daily support.

From there we had a clear market structure break on the daily. You could make a case and say that we actually had two market structure breaks on the daily timeframe and formed a daily order block at the .489 level. The 9day ema cross of the 21day ema also shows signs of bullishness.
I'm now waiting for a retest to enter. Targets are .518, .500 and .481.
I recommend watching the idea linked to get a better grasp of the situation.
So I decided to look back and chart DoDo. After a massive dump it found support on the weekly level and more recently bouncing from daily support.
From there we had a clear market structure break on the daily. You could make a case and say that we actually had two market structure breaks on the daily timeframe and formed a daily order block at the .489 level. The 9day ema cross of the 21day ema also shows signs of bullishness.
I'm now waiting for a retest to enter. Targets are .518, .500 and .481.
I recommend watching the idea linked to get a better grasp of the situation.

免責聲明
這些資訊和出版物並非旨在提供,也不構成TradingView提供或認可的任何形式的財務、投資、交易或其他類型的建議或推薦。請閱讀使用條款以了解更多資訊。