
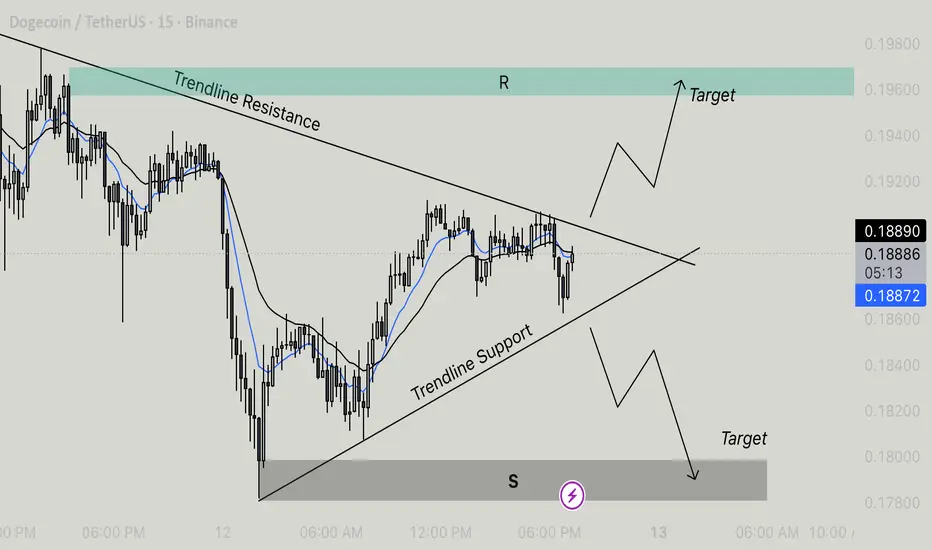
The chart shows Dogecoin currently consolidating within a symmetrical triangle pattern — characterized by converging trendlines of resistance and support. This pattern typically signals an impending breakout, but the direction (upward or downward) depends on which boundary the price breaches first.
⸻
Key Levels
• Resistance Zone (R): Around 0.19600, marked by the upper trendline.
• Support Zone (S): Around 0.17800, marked by the lower trendline.
• Current Price: Approximately 0.1888 USDT.
⸻
Technical Outlook
• Trendline Resistance: Price has tested the upper boundary multiple times but has yet to break above it. A successful breakout above this line could trigger bullish momentum toward the 0.19600 target area.
• Trendline Support: The lower boundary is holding as dynamic support. A breakdown below this level would indicate bearish continuation, with a potential move toward the 0.17800 target zone.
• Moving Averages: The blue (short-term) moving average is closely tracking the black (medium-term) average, showing consolidation and indecision in the market. A crossover above or below could confirm breakout direction.
⸻
Scenarios
• Bullish Scenario:
If DOGE breaks above the resistance trendline, expect upside continuation toward 0.195–0.196 USDT. This would confirm a bullish breakout from the symmetrical triangle pattern.
• Bearish Scenario:
A decisive close below the trendline support could signal downward momentum, with a target near 0.178 USDT.
⸻
Summary
Dogecoin is at a critical decision point within a symmetrical triangle. Traders should watch for a confirmed breakout above resistance or breakdown below support for potential trade entries. Volume confirmation will strengthen the reliability of either breakout direction.
⸻
Key Levels
• Resistance Zone (R): Around 0.19600, marked by the upper trendline.
• Support Zone (S): Around 0.17800, marked by the lower trendline.
• Current Price: Approximately 0.1888 USDT.
⸻
Technical Outlook
• Trendline Resistance: Price has tested the upper boundary multiple times but has yet to break above it. A successful breakout above this line could trigger bullish momentum toward the 0.19600 target area.
• Trendline Support: The lower boundary is holding as dynamic support. A breakdown below this level would indicate bearish continuation, with a potential move toward the 0.17800 target zone.
• Moving Averages: The blue (short-term) moving average is closely tracking the black (medium-term) average, showing consolidation and indecision in the market. A crossover above or below could confirm breakout direction.
⸻
Scenarios
• Bullish Scenario:
If DOGE breaks above the resistance trendline, expect upside continuation toward 0.195–0.196 USDT. This would confirm a bullish breakout from the symmetrical triangle pattern.
• Bearish Scenario:
A decisive close below the trendline support could signal downward momentum, with a target near 0.178 USDT.
⸻
Summary
Dogecoin is at a critical decision point within a symmetrical triangle. Traders should watch for a confirmed breakout above resistance or breakdown below support for potential trade entries. Volume confirmation will strengthen the reliability of either breakout direction.

免責聲明
這些資訊和出版物並非旨在提供,也不構成TradingView提供或認可的任何形式的財務、投資、交易或其他類型的建議或推薦。請閱讀使用條款以了解更多資訊。
免責聲明
這些資訊和出版物並非旨在提供,也不構成TradingView提供或認可的任何形式的財務、投資、交易或其他類型的建議或推薦。請閱讀使用條款以了解更多資訊。