
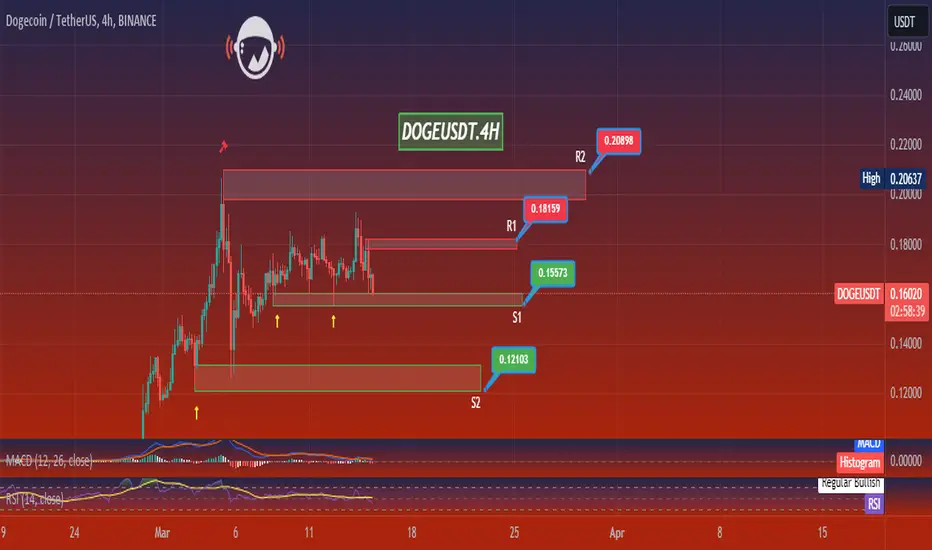
In the 4-hour DOGE/USDT chart, we’re witnessing a recent decline in price after an uptrend.
Resistance Levels (R1, R2): Resistance is found at 0.18159 USDT (R1) and 0.20989 USDT (R2). These may represent points where the asset has historically faced selling pressure and could act as target levels for future price increases.
Support Levels (S1, S2): Support is established at 0.15573 USDT (S1) and 0.12103 USDT (S2). These could be pivotal zones where the price may stabilize or bounce if downward pressure continues.
MACD (Moving Average Convergence Divergence): The MACD line is below the signal line, suggesting bearish momentum. The histogram is also negative, supporting this sentiment.
RSI (Relative Strength Index): The RSI is hovering around 51, indicating a relatively balanced market with neither overbought nor oversold conditions.
Conclusion:
Given the current scenario, I would watch for how the price interacts with the first support level (S1). If it holds, it might provide a good entry point for a potential rebound, especially if other indicators like the MACD start to show a shift in momentum. If S1 fails to hold, I’d consider S2 as the next area of interest for support. For resistance, if the price rebounds and approaches R1, I’d assess the strength of the move and consider taking profits if the price struggled to break through. Stop losses would be strategically placed below support levels to manage risk. It's essential to also pay attention to market news and sentiments that could influence Dogecoin's price.
Resistance Levels (R1, R2): Resistance is found at 0.18159 USDT (R1) and 0.20989 USDT (R2). These may represent points where the asset has historically faced selling pressure and could act as target levels for future price increases.
Support Levels (S1, S2): Support is established at 0.15573 USDT (S1) and 0.12103 USDT (S2). These could be pivotal zones where the price may stabilize or bounce if downward pressure continues.
MACD (Moving Average Convergence Divergence): The MACD line is below the signal line, suggesting bearish momentum. The histogram is also negative, supporting this sentiment.
RSI (Relative Strength Index): The RSI is hovering around 51, indicating a relatively balanced market with neither overbought nor oversold conditions.
Conclusion:
Given the current scenario, I would watch for how the price interacts with the first support level (S1). If it holds, it might provide a good entry point for a potential rebound, especially if other indicators like the MACD start to show a shift in momentum. If S1 fails to hold, I’d consider S2 as the next area of interest for support. For resistance, if the price rebounds and approaches R1, I’d assess the strength of the move and consider taking profits if the price struggled to break through. Stop losses would be strategically placed below support levels to manage risk. It's essential to also pay attention to market news and sentiments that could influence Dogecoin's price.

免責聲明
這些資訊和出版物並非旨在提供,也不構成TradingView提供或認可的任何形式的財務、投資、交易或其他類型的建議或推薦。請閱讀使用條款以了解更多資訊。
免責聲明
這些資訊和出版物並非旨在提供,也不構成TradingView提供或認可的任何形式的財務、投資、交易或其他類型的建議或推薦。請閱讀使用條款以了解更多資訊。