
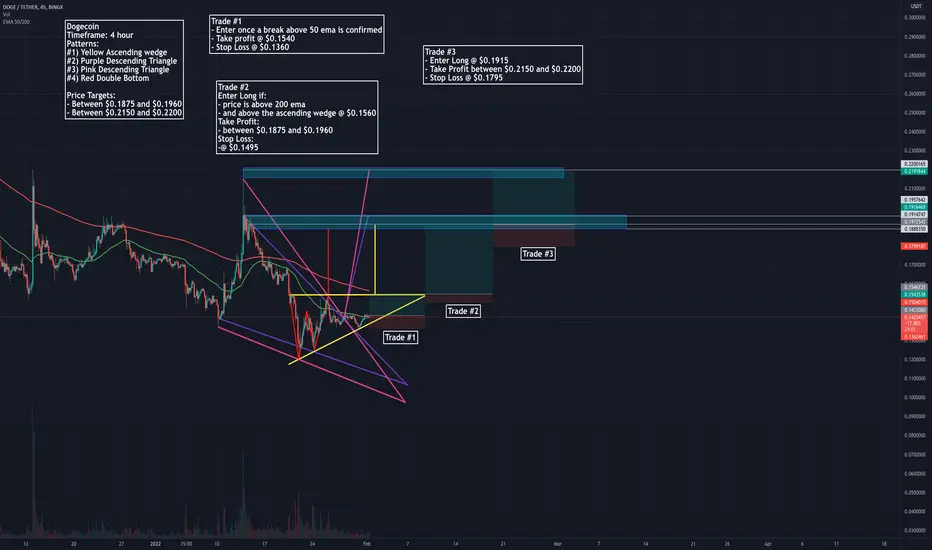
Doge on the 4 hour time frame,
I have identified multiple patterns,
(each one is indicated on the chart in different colors.)
These patterns have very similar price targets
Which makes me more confident in potential success of my trade set ups.
Indicators: 200 EMA (red) 50 EMA (green)
The 50 EMA is currently holding down the price, but a break above it should allow the price to hit the top of the ascending wedge (yellow) Which is inline with the 200 EMA (the next resistance)
The patters I found and their price targets are:
#1) Ascending wedge (Yellow)
- Price target: $0.1915
#2) Descending Triangle (Purple)
- Price target around $0.1960
#3) Descending Triangle (Pink)
- Price target: $0.2200
#4) Double Bottom (Red)
- Price target: $0.1890
The first trade could be taken once price breaks above the 50 EMA (green)
- Price target: at the top of the yellow wedge ($0.1540)
- And a stop loss trailing the bottom Support Line (Bottom Yellow line)
The Second Trade:
Enter Long If and When:
- The price is above 200 EMA
- And the Ascending wedge is broken out of (Turning $0.1540 into support)
Stop Loss:
- Under the Support zone: @ $0.1495
Take Profit:
- Between $0.1875 and $0.1960
The Third Trade:
Enter long:
- once $0.19 is broken and becomes support
Stop Loss:
- $0.1795
Take Profit:
- Between $0.2150 and $0.22
Not financial Advice
Please leave a comment if you have anything to add, I would like to hear your thoughts.
I have identified multiple patterns,
(each one is indicated on the chart in different colors.)
These patterns have very similar price targets
Which makes me more confident in potential success of my trade set ups.
Indicators: 200 EMA (red) 50 EMA (green)
The 50 EMA is currently holding down the price, but a break above it should allow the price to hit the top of the ascending wedge (yellow) Which is inline with the 200 EMA (the next resistance)
The patters I found and their price targets are:
#1) Ascending wedge (Yellow)
- Price target: $0.1915
#2) Descending Triangle (Purple)
- Price target around $0.1960
#3) Descending Triangle (Pink)
- Price target: $0.2200
#4) Double Bottom (Red)
- Price target: $0.1890
The first trade could be taken once price breaks above the 50 EMA (green)
- Price target: at the top of the yellow wedge ($0.1540)
- And a stop loss trailing the bottom Support Line (Bottom Yellow line)
The Second Trade:
Enter Long If and When:
- The price is above 200 EMA
- And the Ascending wedge is broken out of (Turning $0.1540 into support)
Stop Loss:
- Under the Support zone: @ $0.1495
Take Profit:
- Between $0.1875 and $0.1960
The Third Trade:
Enter long:
- once $0.19 is broken and becomes support
Stop Loss:
- $0.1795
Take Profit:
- Between $0.2150 and $0.22
Not financial Advice
Please leave a comment if you have anything to add, I would like to hear your thoughts.
交易結束:達到停損點
交易進行
交易結束:達到停損點

免責聲明
這些資訊和出版物並非旨在提供,也不構成TradingView提供或認可的任何形式的財務、投資、交易或其他類型的建議或推薦。請閱讀使用條款以了解更多資訊。
免責聲明
這些資訊和出版物並非旨在提供,也不構成TradingView提供或認可的任何形式的財務、投資、交易或其他類型的建議或推薦。請閱讀使用條款以了解更多資訊。