
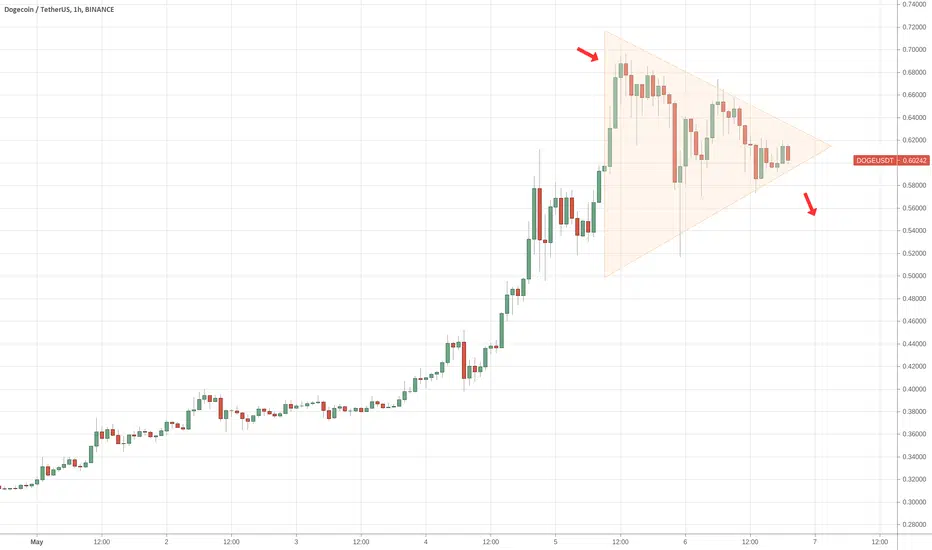
This is how I read this triangle. It's a bit marginal feeling that I throw in, like how much away from the triangle border should I take to make this valid. So all very subjective.
Next to my observation here I also take into account previous findings and predictions and some are referenced below in the list of links to related ideas.
Triangle theory says when price action is entering northside it will eventually going south. This can be influenced by new market order orders obviously so it will remain a calculated gamble so to speak.
Follow this symbol over longer period of time in case your stop loss order gets hit. It may be be just too tight, which is certainly always a wild gamble without doubt.

免責聲明
這些資訊和出版物並非旨在提供,也不構成TradingView提供或認可的任何形式的財務、投資、交易或其他類型的建議或推薦。請閱讀使用條款以了解更多資訊。