
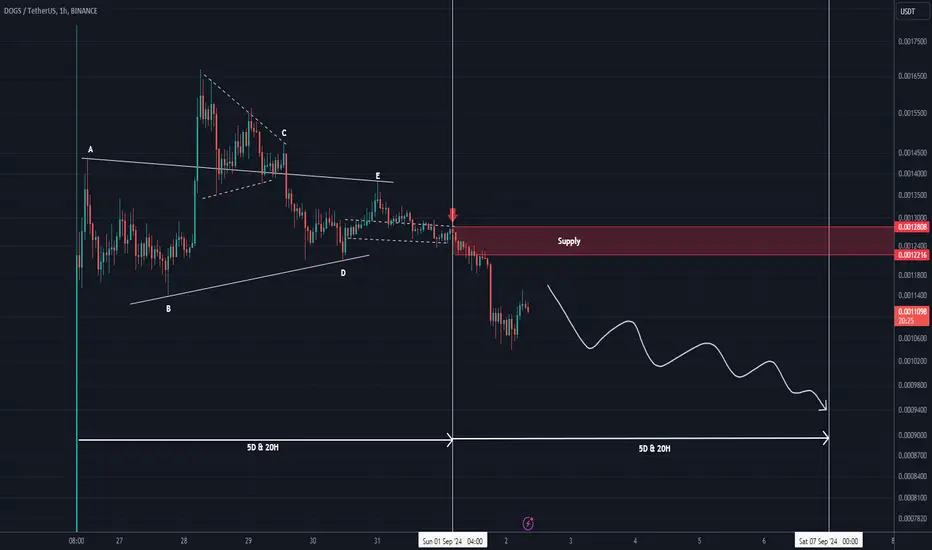
As you know, there is not much data available from DOGS and it cannot be analyzed accurately, it is not clear how far the DOGS symbol will drop in terms of price, but DOGS can be analyzed in terms of time.
Before anything, pay attention to the time frame, the time frame is 1H.
When we put the red arrow on the chart, it seems that the DOGS bullish pattern has ended and the bearish pattern has begun.
A bullish pattern lasted for 5 days and 20 hours, and a bearish pattern is expected to take the same amount of time.
Until the date of the vertical line we have marked on the chart, the DOGS correction is expected to continue.
For risk management, please don't forget stop loss and capital management
Comment if you have any questions
Thank You
Before anything, pay attention to the time frame, the time frame is 1H.
When we put the red arrow on the chart, it seems that the DOGS bullish pattern has ended and the bearish pattern has begun.
A bullish pattern lasted for 5 days and 20 hours, and a bearish pattern is expected to take the same amount of time.
Until the date of the vertical line we have marked on the chart, the DOGS correction is expected to continue.
For risk management, please don't forget stop loss and capital management
Comment if you have any questions
Thank You
交易結束:目標達成
The correction continued until the specified time (vertical line on the right) and dropped 17% from the specified point.To publish new analysis on DOGS, we need to have more data on the chart and see good patterns in our method.

✅ Join our Telegram channel to succeed in crypto trading.
💎Our CRYPTO Telegram Channel: 👉 t.me/Behdark_EN
💎Our FOREX Telegram Channel: 👉 t.me/FX_Behdark
💎Our CRYPTO Telegram Channel: 👉 t.me/Behdark_EN
💎Our FOREX Telegram Channel: 👉 t.me/FX_Behdark
免責聲明
這些資訊和出版物並非旨在提供,也不構成TradingView提供或認可的任何形式的財務、投資、交易或其他類型的建議或推薦。請閱讀使用條款以了解更多資訊。
✅ Join our Telegram channel to succeed in crypto trading.
💎Our CRYPTO Telegram Channel: 👉 t.me/Behdark_EN
💎Our FOREX Telegram Channel: 👉 t.me/FX_Behdark
💎Our CRYPTO Telegram Channel: 👉 t.me/Behdark_EN
💎Our FOREX Telegram Channel: 👉 t.me/FX_Behdark
免責聲明
這些資訊和出版物並非旨在提供,也不構成TradingView提供或認可的任何形式的財務、投資、交易或其他類型的建議或推薦。請閱讀使用條款以了解更多資訊。