
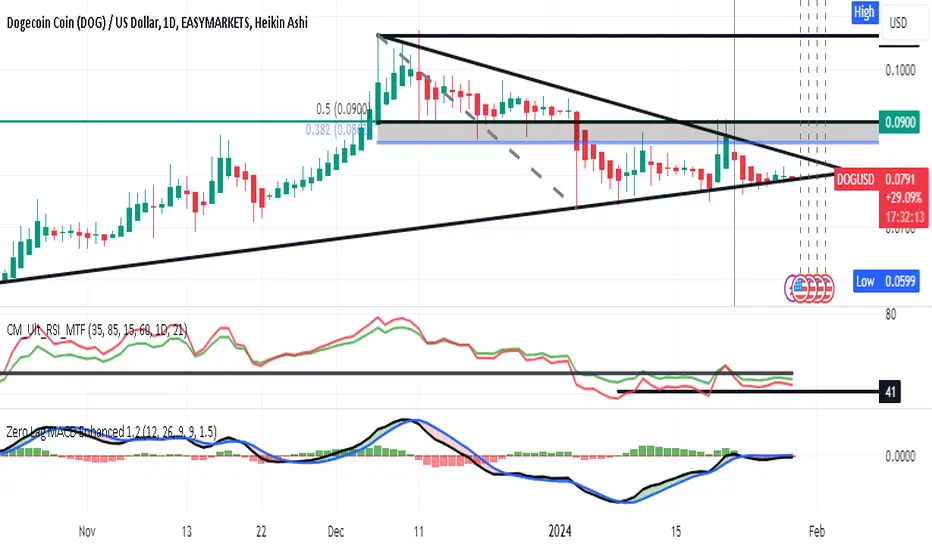
On the daily chart. DOGEUSD appears to be at the support line of a symmetrical triangle
pattern with about 30% upside to the pivot high in early December. The RSI lines are stable
and flat sideways in the 40-45 range. The zero-lag MACD shows lines near to the horizontal
zero level. The Fib tool suggests that a retrace to 0.09 is a reasonable target level.
Accordingly, an upside of 30% is forecasted for the next bullish spike. I will wait for a cross of
a shorter MA line over a longer MA line as a "golden cross" sign of bullish momentum and take a
position there .
交易進行
30 minute time frame zoom in here:交易進行
Sideways since the idea in accumulation. Looking for more with full position.
免責聲明
這些資訊和出版物並非旨在提供,也不構成TradingView提供或認可的任何形式的財務、投資、交易或其他類型的建議或推薦。請閱讀使用條款以了解更多資訊。
免責聲明
這些資訊和出版物並非旨在提供,也不構成TradingView提供或認可的任何形式的財務、投資、交易或其他類型的建議或推薦。請閱讀使用條款以了解更多資訊。