
Hello all, and thanks for supporting my channel.
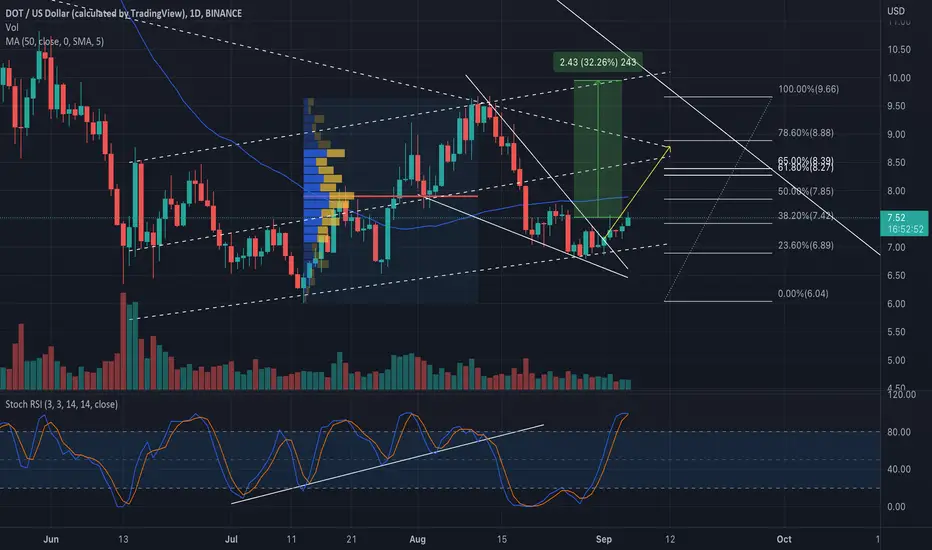
Looking at DOTUSD on the daily timeframe, we see a formation of a falling wedge pattern which has a bullish price target at $8.90. This price also corresponds with the 78% fibonacci retracement level and is also the top of the weekly candle formation.
On the daily timeframe we are also trading inside the ascending channel which has support level sitting at $7 and resistance level at $10. For this channel, the Fixed Range Volume Profile provides a point of control at around $7.85 which is also the 50% Fibonacci retracement level.
On the 4hr timeframe, DOT broke bullish out of the $7.50 price, and is currently retesting this price for support.
As such, if the price of DOT can clear the $8 mark, we can retest the top of the channel at $10. This is approximately 30% move to the upside from the current point.
Thanks for reading, and stay tuned. Enjoy.
Looking at DOTUSD on the daily timeframe, we see a formation of a falling wedge pattern which has a bullish price target at $8.90. This price also corresponds with the 78% fibonacci retracement level and is also the top of the weekly candle formation.
On the daily timeframe we are also trading inside the ascending channel which has support level sitting at $7 and resistance level at $10. For this channel, the Fixed Range Volume Profile provides a point of control at around $7.85 which is also the 50% Fibonacci retracement level.
On the 4hr timeframe, DOT broke bullish out of the $7.50 price, and is currently retesting this price for support.
As such, if the price of DOT can clear the $8 mark, we can retest the top of the channel at $10. This is approximately 30% move to the upside from the current point.
Thanks for reading, and stay tuned. Enjoy.

免責聲明
這些資訊和出版物並非旨在提供,也不構成TradingView提供或認可的任何形式的財務、投資、交易或其他類型的建議或推薦。請閱讀使用條款以了解更多資訊。
免責聲明
這些資訊和出版物並非旨在提供,也不構成TradingView提供或認可的任何形式的財務、投資、交易或其他類型的建議或推薦。請閱讀使用條款以了解更多資訊。