
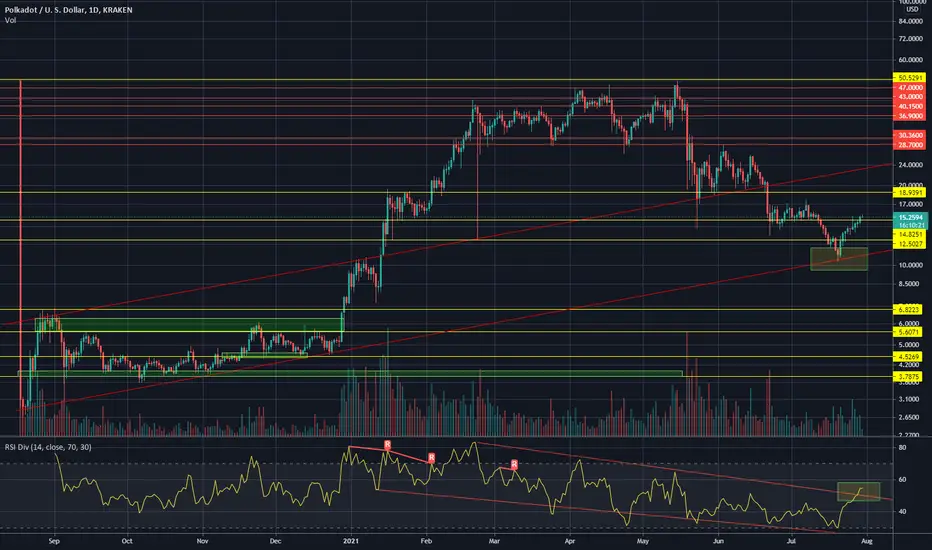
I think DOT completed the correction when it has returned to bottom of the long-term trend line at $10.5. The bounce was followed by increased volume which is indicator buyers took over control. RSI is stepping up and has moved beyond 50 level. Chart is looking good and every price that is close to support trendline (red line) is good buy (NFA). If Bitcoin stay stable and continue to rally, DOT should move up in price as well and return to ATH and beyond.
On a Weekly time frame DOT closed as bullish hammer which is very positive sign. Over the weekend monthly candle will be formed which will be important indicator for future price development.
On a Weekly time frame DOT closed as bullish hammer which is very positive sign. Over the weekend monthly candle will be formed which will be important indicator for future price development.

免責聲明
這些資訊和出版物並非旨在提供,也不構成TradingView提供或認可的任何形式的財務、投資、交易或其他類型的建議或推薦。請閱讀使用條款以了解更多資訊。
免責聲明
這些資訊和出版物並非旨在提供,也不構成TradingView提供或認可的任何形式的財務、投資、交易或其他類型的建議或推薦。請閱讀使用條款以了解更多資訊。