
hi traders,
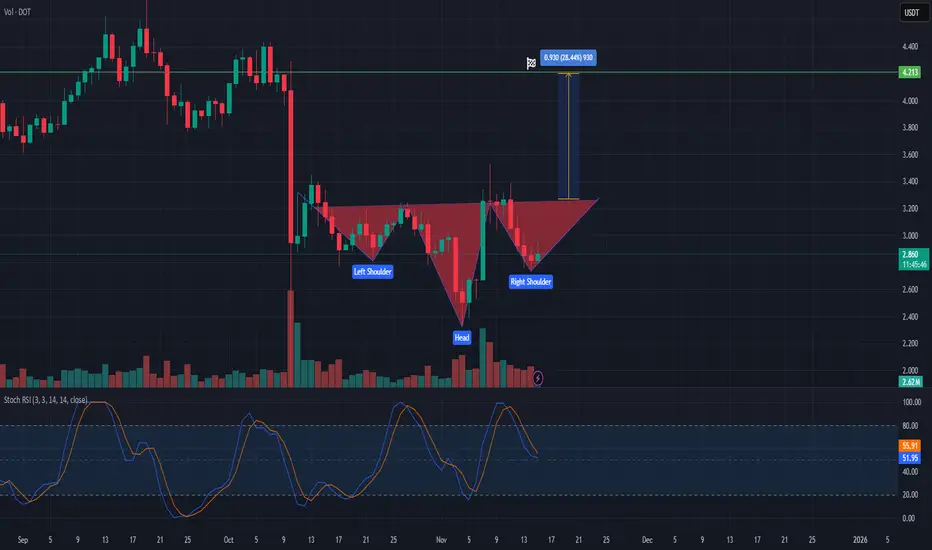
DOT is currently forming a bullish inverted head and shoulders pattern on the daily chart, suggesting a potential medium-term trend reversal to the upside.
Left Shoulder: Price declines and rebounds, creating the first swing low.
Head: A deeper sell-off forms the lowest point of the structure before buyers step back in.
Right Shoulder: Price is now developing the right shoulder, with higher lows indicating strengthening bullish momentum.
The neckline resistance sits slightly above the current price. A confirmed daily close above the neckline would complete the pattern and trigger a potential breakout.
The projected target, measured from the head to the neckline and extended upward from the breakout point, suggests an approximate 28% upside move, with the target area around 4.21 USDT.
The Stochastic RSI is currently in mid-range and curling upward, providing additional momentum support for a potential bullish breakout.
Trading Plan Considerations:
Entry: Upon a decisive breakout and daily close above the neckline.
Target: ~4.21 USDT (pattern completion target).
Invalidation: Breakdown below the right shoulder low would invalidate this setup.
DOT is currently forming a bullish inverted head and shoulders pattern on the daily chart, suggesting a potential medium-term trend reversal to the upside.
Left Shoulder: Price declines and rebounds, creating the first swing low.
Head: A deeper sell-off forms the lowest point of the structure before buyers step back in.
Right Shoulder: Price is now developing the right shoulder, with higher lows indicating strengthening bullish momentum.
The neckline resistance sits slightly above the current price. A confirmed daily close above the neckline would complete the pattern and trigger a potential breakout.
The projected target, measured from the head to the neckline and extended upward from the breakout point, suggests an approximate 28% upside move, with the target area around 4.21 USDT.
The Stochastic RSI is currently in mid-range and curling upward, providing additional momentum support for a potential bullish breakout.
Trading Plan Considerations:
Entry: Upon a decisive breakout and daily close above the neckline.
Target: ~4.21 USDT (pattern completion target).
Invalidation: Breakdown below the right shoulder low would invalidate this setup.

💥 Free signals and ideas ➡ t.me/vfinvestment
免責聲明
這些資訊和出版物並非旨在提供,也不構成TradingView提供或認可的任何形式的財務、投資、交易或其他類型的建議或推薦。請閱讀使用條款以了解更多資訊。
💥 Free signals and ideas ➡ t.me/vfinvestment
免責聲明
這些資訊和出版物並非旨在提供,也不構成TradingView提供或認可的任何形式的財務、投資、交易或其他類型的建議或推薦。請閱讀使用條款以了解更多資訊。